empty
16.01.2025 04:19 AM
Trading Recommendations and Analysis for EUR/USD on January 16: Another Logical Collapse

EUR/USD 5-Minute Analysis

This image is no longer relevant

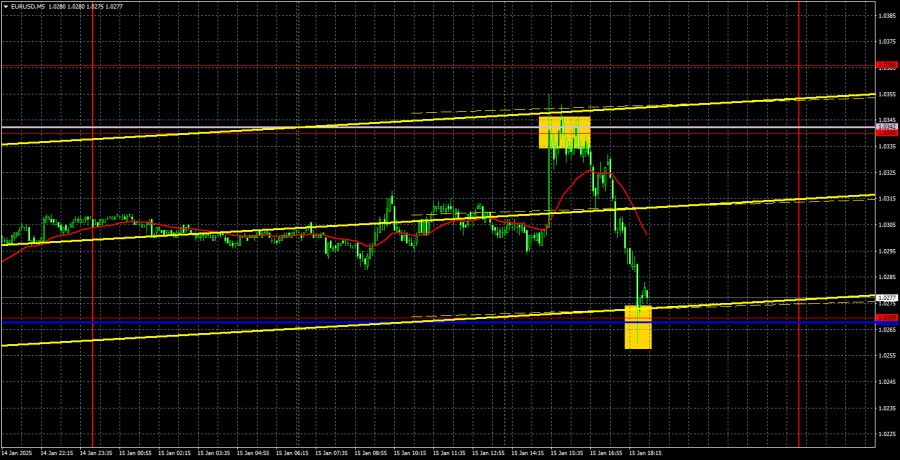
On Wednesday, the EUR/USD currency pair initially traded upward for most of the day but later lost all its gains as the euro declined significantly. In our fundamental analysis, we highlighted the mixed nature of the U.S. inflation report. The market's initial reaction was to sell the dollar, which seemed somewhat irrational. While the headline inflation figure met expectations, U.S. inflation still increased, indicating that the Federal Reserve might not lower rates as much as the two modest rate cuts anticipated in 2025. This situation is further complicated by Donald Trump's upcoming presidency, which may bring various tariffs that could escalate global inflation.

The evening decline in the euro was more understandable. First, the global downtrend remains in effect. Second, the fundamental and macroeconomic conditions continue to favor the dollar. Third, the price corrected and rebounded precisely from the Senkou Span B line. Even on the previous day, there were reasons to consider buying the dollar again, despite the mixed inflation report.

Trading signals on Wednesday were excellent. During the U.S. session, the currency pair tested the 1.0340 level and the Senkou Span B line, rebounding sharply. This was followed by a decline that again tested this critical line, from which the price also bounced. As a result, traders had the opportunity to open two trades that yielded profit. A long position can even be maintained.

COT Report

This image is no longer relevant

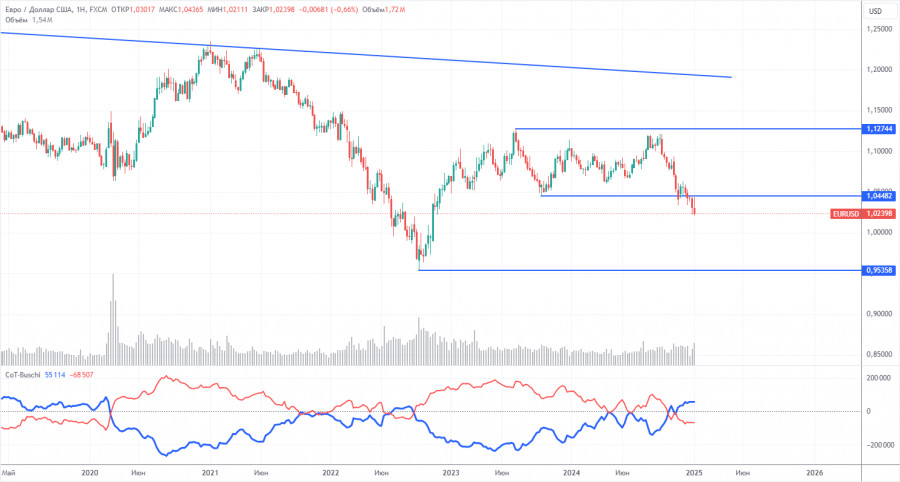
The latest Commitment of Traders (COT) report, dated December 31, indicates that non-commercial traders maintain a bullish net position. However, bears have recently gained the upper hand. Two months ago, the number of short positions among professional traders surged, resulting in a negative net position for the first time in a long while. This change suggests that the euro is being sold more frequently than it is being bought.

We have yet to identify any fundamental drivers for euro strength. From a technical perspective, the EUR/USD pair has been consolidating for quite some time. On the weekly timeframe, it has traded between 1.0448 and 1.1274 since December 2022. The breach of the 1.0448 level has opened the door for further declines.

Additionally, the COT data shows that the red and blue lines have crossed, signaling a bearish market sentiment. In the last reporting week, long positions among non-commercial traders increased by 9,300, while short positions rose by 10,400, resulting in a reduction of the net position by 1,100.

EUR/USD 1-Hour Analysis

This image is no longer relevant

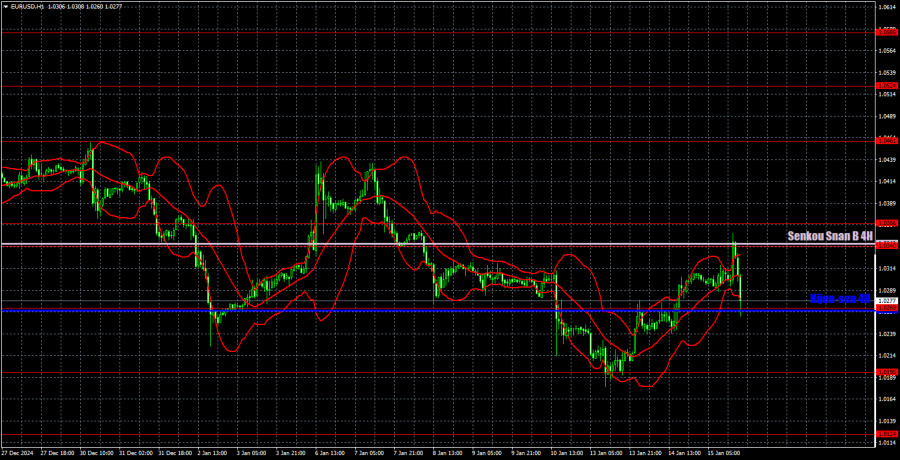
On the hourly chart, the currency pair has resumed its downtrend, which has persisted for over three months. We believe this decline will continue in the medium term. The Fed might cut interest rates just 1–2 times in 2025, indicating a more hawkish stance than the market initially expected. This factor, among others, will continue to support the U.S. dollar. The bearish sentiment remains intact below the Ichimoku indicator lines, even in the short term.

For trading on January 16, the following levels are highlighted: 1.0124, 1.0195, 1.0269, 1.0340–1.0366, 1.0461, 1.0524, 1.0585, 1.0658–1.0669, 1.0757, 1.0797, and 1.0843, as well as the Senkou Span B (1.0342) and Kijun-sen (1.0267) lines. Please note that the Ichimoku indicator lines may shift throughout the day, which should be considered when determining trading signals. Remember to set a Stop Loss at breakeven if the price moves 15 pips in your favor, to protect against potential losses from false signals.

On Thursday, the Eurozone will release a secondary report on German inflation, while the U.S. is set to publish slightly more significant retail sales data and equally secondary jobless claims. Therefore, we do not expect strong price movements today. Below the Senkou Span B line, even a short-term uptrend remains unlikely.

Illustration Explanations:

  • Support and Resistance Levels (thick red lines): Thick red lines indicate where movement may come to an end. Please note that these lines are not sources of trading signals.
  • Kijun-sen and Senkou Span B Lines: Ichimoku indicator lines transferred from the 4-hour timeframe to the hourly timeframe. These are strong lines.
  • Extreme Levels (thin red lines): Thin red lines where the price has previously bounced. These serve as sources of trading signals.
  • Yellow Lines: Trendlines, trend channels, or any other technical patterns.
  • Indicator 1 on COT Charts: Represents the net position size for each category of traders.
Paolo Greco,
Chuyên gia phân tích của InstaForex
© 2007-2025
Chọn khung thời gian
5
phút
15
phút
30
phút
1
giờ
4
ngày
1
ngày
1
tuần
Kiếm lợi nhuận từ những biến đổi giá của tiền điện tử với InstaForex.
Tải MetaTrader 4 và mở giao dịch đầu tiên của bạn.
  • Tiền gửi lần truy cập
    Ký quỹ tài khoản của bạn với $3000 và nhận được $8000 nhiều hơn!
    Trong Tháng 3 chúng tôi xổ $8000 trong chiến dịch Chancy Deposit!
    Có được một cơ hội giành chiến thắng bằng việc ký quỹ $3000 vào một tài khoản giao dịch. Đáp ứng được điều kiện này, bạn trở thành một người tham gia chiến dịch.
    THAM GIA CUỘC THI

Các bài báo được đề xuất

GBP/USD: Kế Hoạch Giao Dịch Phiên Mỹ Ngày 28 Tháng Ba (Đánh Giá Giao Dịch Buổi Sáng)

Trong dự báo buổi sáng của tôi, tôi tập trung vào mức 1.2964 và lên kế hoạch đưa ra quyết định tham gia thị trường dựa trên

Miroslaw Bawulski 18:54 2025-03-28 UTC+2

EUR/USD: Kế hoạch giao dịch cho phiên Mỹ vào ngày 28 tháng 3 (Đánh giá giao dịch buổi sáng)

Trong dự báo buổi sáng của tôi, tôi đã nhấn mạnh mức 1.0801 và lên kế hoạch dựa vào nó để thực hiện các lệnh giao dịch. Hãy nhìn

Miroslaw Bawulski 18:52 2025-03-28 UTC+2

Cách giao dịch cặp GBP/USD vào ngày 28 tháng 3? Mẹo đơn giản và phân tích giao dịch cho người mới bắt đầu

Vào thứ Năm, cặp tỷ giá GBP/USD cũng giao dịch tăng và khá mạnh. Mặc dù báo cáo GDP quý 4 của Hoa Kỳ khá tốt được công bố, nhưng

Paolo Greco 06:05 2025-03-28 UTC+2

Cách giao dịch cặp EUR/USD vào ngày 28 tháng 3? Mẹo đơn giản và phân tích giao dịch cho người mới bắt đầu

Cặp tiền tệ EUR/USD đã tăng lên mức 1.0804 vào thứ Năm. Tự nhiên, một sự tăng mạnh và bất ngờ của đồng euro (hoặc chính

Paolo Greco 06:05 2025-03-28 UTC+2

Khuyến nghị và Phân tích giao dịch cho GBP/USD ngày 28 tháng 3: Đồng bảng Anh tiếp tục dao động

Cặp tiền tệ GBP/USD đã cho thấy một sự chuyển động mạnh mẽ lên cao vào thứ Năm. Tự nhiên, một lần nữa, tác nhân chính là Donald Trump, người

Paolo Greco 02:47 2025-03-28 UTC+2

Khuyến nghị và Phân tích Giao dịch cho EUR/USD vào ngày 28 tháng 3: Thuế quan của Trump và GDP

Vào thứ Năm, cặp tiền tệ EUR/USD tăng mạnh mà không phá vỡ xu hướng giảm kéo dài trong vài ngày gần đây. Có những lý do xác đáng khiến

Paolo Greco 02:47 2025-03-28 UTC+2

GBP/USD: Kế Hoạch Giao Dịch cho Phiên Hoa Kỳ ngày 27 tháng 3 (Đánh Giá Giao Dịch Buổi Sáng)

Trong dự báo buổi sáng của tôi, tôi đã tập trung vào mức 1.2916 và lập kế hoạch đưa ra quyết định giao dịch dựa trên

Miroslaw Bawulski 17:56 2025-03-27 UTC+2

EUR/USD: Kế Hoạch Giao Dịch Cho Phiên Mỹ Ngày 27 Tháng 3 (Đánh Giá Các Giao Dịch Buổi Sáng)

Trong dự báo buổi sáng, tôi tập trung vào mức 1.0769 và lên kế hoạch thực hiện quyết định giao dịch dựa trên mức này. Hãy xem biểu

Miroslaw Bawulski 17:53 2025-03-27 UTC+2

Cách giao dịch cặp GBP/USD vào ngày 27 tháng 3? Mẹo đơn giản và phân tích giao dịch cho người mới bắt đầu

Vào thứ Tư, cặp tiền tệ GBP/USD đã thể hiện sự chuyển động giảm mà cuối cùng cũng phù hợp với bối cảnh kinh tế vĩ mô. Trong ngày

Paolo Greco 05:42 2025-03-27 UTC+2

Cách giao dịch cặp EUR/USD vào ngày 27 tháng 3? Mẹo đơn giản và phân tích giao dịch cho người mới bắt đầu

Vào thứ Tư, cặp tiền tệ EUR/USD tiếp tục xu hướng giảm nhẹ. Sự mất giá của euro là khá hợp lý, mặc dù các nhà giao dịch

Paolo Greco 05:42 2025-03-27 UTC+2
Không thể nói chuyện ngay bây giờ?
Đặt câu hỏi của bạn trong phần trò chuyện.
Widget callback
 

Dear visitor,

Your IP address shows that you are currently located in the USA. If you are a resident of the United States, you are prohibited from using the services of InstaFintech Group including online trading, online transfers, deposit/withdrawal of funds, etc.

If you think you are seeing this message by mistake and your location is not the US, kindly proceed to the website. Otherwise, you must leave the website in order to comply with government restrictions.

Why does your IP address show your location as the USA?

  • - you are using a VPN provided by a hosting company based in the United States;
  • - your IP does not have proper WHOIS records;
  • - an error occurred in the WHOIS geolocation database.

Please confirm whether you are a US resident or not by clicking the relevant button below. If you choose the wrong option, being a US resident, you will not be able to open an account with InstaForex anyway.

We are sorry for any inconvenience caused by this message.