empty
08.02.2023 08:17 PM
Technical analysis of EUR/USD for February 08, 2023

This image is no longer relevant

Overview:

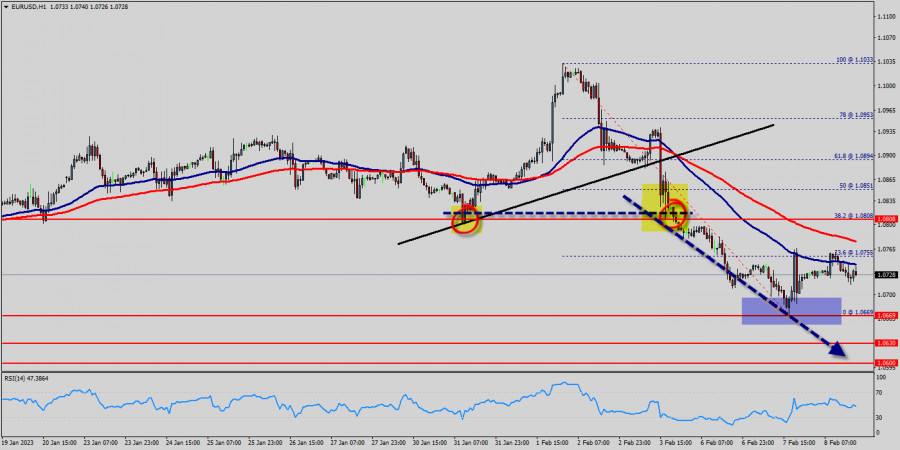
The EUR/USD pair has faced strong resistances at the levels of 1.0880 because support had become resistance last week. So, the strong resistance has been already formed at the level of 1.0880 and the pair is likely to try to approach it in order to test it again. However, if the pair fails to pass through the level of 1.0880, the market will indicate a bearish opportunity below the new strong resistance level of 1.0880 (the level of 1.0880 coincides with a ratio of 38.2% Fibonacci - last bullish wave - double top).

Moreover, the RSI starts signaling a downward trend, as the trend is still showing strength above the moving average (100) and (50). The trend of EUR/USD pair movement was controversial as it took place in the downtrend channel.

Due to the previous events, the price is still set between the levels of 1.0808 and 1.0669, so it is recommended to be careful while making deals in these levels because the prices of 1.0808 and 1.0669 are representing the resistance and support respectively.

Therefore, it is necessary to wait till the downtrend channel is passed through. Then the market will probably show the signs of a bearish market.

It should be noted that the volatility is very high for that the price of the EUR/USD pair is still trading between the prices of 1.0669 and 1.0808 in the coming hours.

Furthermore, the price has been set below the strong resistance at the levels of 1.0808 and 1.0851 which coincide with the 38.2% and 50% Fibonacci retracement levels respectively.

Thus, the market is indicating a bearish opportunity below 1.0808 so it will be good to sell at 1.0808 with the first target of 1.0669.

It will also call for a downtrend in order to continue towards 1.0630. The daily strong support is seen at 1.0600.

However, the stop loss should always be taken into account, for that it will be reasonable to set your stop loss at the level of 1.0851.

Moving averages, in the meantime, maintain their bearish slope way above the current level. Furthermore, although the news is bearish for the EUR/USD pair, professional may not want to sell weakness, but rather following a rebound rally.

Additionally, some aggressive counter-trend buyers may be defending parity. In case a continuousion takes place and the EUR/USD pair breaks through the support level of 1.0669 , a further decline to 1.0600 can occur which would indicate a bearish market.

Signal :

It should be noted that the 1.0808 price will act as a major resistance on Feb. 08th, 2023. Therefore, it will be too gainful to sell short below 1.0808 and look for further downside with 1.0669, 1.0630 and 1.0600 targets. It should also be reminded that stop loss must never exceed the maximum exposure amounts. Thus, stop loss should be placed at the 1.0851 level today.

เลือกช่วงเวลา
5
นาที
15
นาที
30
นาที
1
ชั่วโมง
4
ชั่วโมง
1
วัน
1
สัปดาห์
รับผลกำไรจากการเปลี่ยนแปลงอัตราสกุลเงินดิจิทัลกับ InstaForex.
ดาวน์โหลด MetaTrader 4 และเปิดการซื้อขายครั้งแรกของคุณ.
การวิเคราะห์ EUR/USD - 31 มีนาคม โครงสร้างคลื่นบนแผนภูมิ 4 ชั่วโมงของ EUR/USD กำลังมีความเสี่ยงที่จะเปลี่ยนรูปร่างเป็นรูปแบบที่ซับซ้อนยิ่งขึ้น ในวันที่ 25 กันยายนปีที่ผ่านมา โครงสร้างลดลงใหม่เริ่มที่จะการสร้างและอยู่ในรูปแบบของลัพธ์คลื่นห้า สามเดือนที่ผ่านมา โครงสร้างแก้ไขขึ้นเริ่มที่จะการสร้างในที่ควรจะประกอบด้วยคลื่นอย่างน้อยสามคลื่น โครงสร้างของคลื่อแรกถูกสร้างขึ้นอย่างดีและจึงทำให้ฉันคาดว่าคลื่นที่สองจะต้องมีรูปร่างที่ชัดเจนเช่นเดียวกัน อย่างไรก็ตาม ขนาดของคลื่นนี้ใหญ่มากจนเป็นอันตรายถ้ามันเปลี่ยนรูปแบบคลื่นอย่างมาก ข่าวสารที่ส่งออกมายังคงสนับสนุนผู้ขายมากกว่าผู้ซื้อเมื่อมาถึงข้อมูลทางเศรษฐกิจ
  • Grand Choice
    Contest by
    InstaForex
    InstaForex always strives to help you
    fulfill your biggest dreams.
    เข้าร่วมการแข่งขัน


บทความแนะนำ

การคาดการณ์สำหรับ GBP/USD ในวันที่ 31 มีนาคม 2025

บนกราฟรายชั่วโมง คู่สกุลเงิน GBP/USD มีการซื้อขายในลักษณะแนวราบในวันศุกร์ แต่การตีกลับสองครั้งจากระดับ 1.2931 ทำให้มีความเป็นไปได้ในการเติบโตไปยังระดับการแก้ไข Fibonacci ที่ 127.2% ที่ 1.3003 การตีกลับจากระดับนี้จะเป็นบวกต่อดอลลาร์สหรัฐและอาจนำไปสู่การลดลงสู่ระดับ 1.2931 การปิดที่เหนือ

Samir Klishi 12:28 2025-03-31 UTC+2

EUR/USD. 31 มีนาคม. ดอลลาร์ไม่มีโอกาส

เมื่อวันศุกร์ คู่สกุลเงิน EUR/USD ได้รวมตัวเหนือโซน 1.0781–1.0797 ทำให้การเคลื่อนไหวขึ้นต่อเนื่องไปยังระดับ Fibonacci 200.0% ที่ 1.0857 การดีดกลับจากระดับนี้จะเป็นปัจจัยบวกต่อเงินดอลลาร์สหรัฐ และอาจก่อให้เกิดการลดลงเล็กน้อยสู่โซนสนับสนุนที่ 1.0781–1.0797 การรวมตัวเหนือระดับ 1.0857

Samir Klishi 11:58 2025-03-31 UTC+2

การคาดการณ์อัตราแลกเปลี่ยน 31/03/2025: EUR/USD, GBP/USD, ทองคำ, น้ำมัน และ Bitcoin

ลิงก์ที่มีประโยชน์: บทความอื่นๆ ของฉันสามารถเข้าถึงได้ในส่วนนี้ คอร์ส InstaForex สำหรับผู้เริ่มต้น การวิเคราะห์ที่เป็นที่นิยม เปิดบัญชีซื้อขาย สำคัญ: ผู้เริ่มต้นในการซื้อขายฟอเร็กซ์จำเป็นต้องระมัดระวังอย่างมากเมื่อทำการตัดสินใจเข้าสู่ตลาด ก่อนการประกาศรายงานสำคัญ ควรหลีกเลี่ยงการเข้าตลาดเพื่อลดความเสี่ยงจากความผันผวนที่อาจเพิ่มขึ้น หากคุณตัดสินใจที่จะซื้อขายในช่วงการประกาศข่าว ควรตั้งค่า stop

Sebastian Seliga 10:50 2025-03-31 UTC+2

การวิเคราะห์ทางเทคนิค EUR/USD และ GBP/USD วันที่ 31 มีนาคม

ในระหว่างสัปดาห์นี้ ผู้เล่นที่มีแนวโน้มขาลงพยายามยืนยันการถอยกลับที่เกิดขึ้นก่อนหน้านี้และดำเนินการลดลงต่อ แต่ไม่ประสบผลสำเร็จ ส่งผลให้เกิดเงาล่างยาวบนกราฟแท่งเทียนประจำสัปดาห์ คู่สกุลเงินได้กลับไปยังกลุ่มระดับแนวต้าน (1.0819–1.0856) ซึ่งขณะนี้ถือว่าเป็นโซนแนวต้านที่ใกล้ที่สุด ภายใต้สภาวะปัจจุบัน อาจมีการรวมตัวใหม่และความไม่แน่นอนเกิดขึ้น การตั้งหลักมั่นคงเหนือระดับ 1.0844–1.0856 จะเปิดโอกาสให้ผู้ซื้ออีกครั้งในการทดสอบขอบบนของเมฆ Ichimoku รายสัปดาห์ (1.0978)

Evangelos Poulakis 09:07 2025-03-31 UTC+2

การพยากรณ์ค่าเงิน EUR/USD สำหรับวันที่ 31 มีนาคม 2025

ผู้เข้าร่วมตลาดกลับมาจับตามองด้วยความกังวลอีกครั้ง เนื่องจากวอชิงตันมีเจตนาที่จะขยายอัตราภาษีเพิ่มขึ้น 20% กับหุ้นส่วนการค้าทั้งหมดของสหรัฐฯ ในวันศุกร์ ดัชนีหุ้น S&P 500 ร่วงลง 1.97% และขณะนี้ตลาดหุ้นอาจมีบทบาทสำคัญในการกำหนดความรู้สึกความเสี่ยง หากเป็นเช่นนั้น ยูโรอาจต้านทานแรงกดดันไม่ไหวและอาจจะเข้าสู่แนวโน้มขาลงในระยะกลาง บนแผนภูมิรายวัน สกุลเงินเดี่ยวก็ยังคงเพิ่มขึ้น

Laurie Bailey 05:20 2025-03-31 UTC+2

การพยากรณ์ GBP/USD สำหรับวันที่ 31 มีนาคม 2025

ในกราฟรายวัน ราคาเคลื่อนที่อยู่ในช่องขาขึ้น หากความเชื่อมั่นยังคงอยู่ ระดับเป้าหมายที่ 1.3184 อาจถูกทะลุ ตัว Marlin oscillator ยังคงเป็นกลางที่เส้นศูนย์ ทำให้มีพื้นที่สำหรับการเติบโตอยู่มาก นักลงทุนชาวอังกฤษยังคงมีความหวังว่าภาษีศุลกากรสำหรับสินค้าจากสหราชอาณาจักรจะต่ำกว่าที่กำหนดไว้กับประเทศอื่น ๆ ซึ่งเป็นความเชื่อที่มีการกล่าวถึงมาตั้งแต่ปลายปีที่แล้ว ตัวชี้วัด

Laurie Bailey 05:13 2025-03-31 UTC+2

การคาดการณ์ USD/JPY สำหรับวันที่ 31 มีนาคม 2025

หลังจากที่ดัชนี S&P 500 ร่วงลง 1.97% เมื่อวันศุกร์ คู่สกุลเงิน USD/JPY ลดลงถึง 120 pips เช้าวันนี้ ดัชนี Nikkei

Laurie Bailey 05:13 2025-03-31 UTC+2

การคาดการณ์ราคาน้ำมันสำหรับวันที่ 31 มีนาคม 2025

น้ำมันดิบ (CL) ยังคงอยู่เหนือเส้นช่องแนวราคาเขียวที่กำลังลงเพียงแค่สองวัน หลังจากที่ลดลง 84 เซนต์ในวันศุกร์ ราคาก็ลดลงต่ำกว่าเส้นช่องนี้. ขณะนี้ ราคาจำเป็นต้องทะลุแนวรับที่ 68.69 เพื่อเคลื่อนที่ไปยัง 66.77 ได้อย่างอิสระ การปรับตัวลงต่อไปอาจดำเนินต่อไปจนถึงช่วง 65.27/80

Laurie Bailey 05:13 2025-03-31 UTC+2

การคาดการณ์ Forex วันที่ 28/03/2025: EUR/USD, GBP/USD, USD/JPY, น้ำมัน และ Bitcoin

ลิงก์ที่มีประโยชน์: บทความอื่นๆ ของฉันสามารถอ่านได้ในส่วนนี้ คอร์ส InstaForex สำหรับผู้เริ่มต้น การวิเคราะห์ยอดนิยม เปิดบัญชีซื้อขาย สำคัญ: ผู้เริ่มต้นในการซื้อขายฟอเร็กซ์จำเป็นต้องระมัดระวังอย่างมากเมื่อทำการตัดสินใจเข้าสู่ตลาด ก่อนที่รายงานสำคัญจะถูกเผยแพร่ ควรหลีกเลี่ยงการเข้าตลาดเพื่อป้องกันการตกอยู่ในภาวะผันผวนสูงเนื่องจากความเคลื่อนไหวทางตลาดที่รุนแรง หากคุณตัดสินใจที่จะทำการซื้อขายในช่วงที่มีการปล่อยข่าว ควรตั้งคำสั่งหยุดขาดทุนอยู่เสมอเพื่อจำกัดการสูญเสีย หากไม่ตั้งคำสั่งหยุดขาดทุน

Sebastian Seliga 23:24 2025-03-28 UTC+2

สัญญาณการซื้อขายสำหรับทองคำ (XAU/USD) สำหรับวันที่ 28-31 มีนาคม 2025: ขายต่ำกว่า $3,078 (การปรับฐานทางเทคนิค - 21 SMA)

ในช่วงแรกของการซื้อขายในสหรัฐฯ ราคาทองคำอยู่ที่ประมาณ 3,078 ซึ่งต่ำกว่าสถิติสูงสุดใหม่ที่ประมาณ 3,086 ซึ่งเคยเกิดขึ้นในช่วงการซื้อขายในยุโรป ทองคำยังคงมีโมเมนตัมเชิงบวก อย่างไรก็ตาม อาจเผชิญกับการปรับฐานทางเทคนิคในชั่วโมงข้างหน้า หากราคาคงที่ต่ำกว่า 3,078 แนวรับสำคัญอยู่ที่บริเวณเส้นเฉลี่ยเคลื่อนที่ 21 SMA ที่

Dimitrios Zappas 14:12 2025-03-28 UTC+2
หากไม่สะดวกคุยในตอนนี้
ระบุคำถามไว้ได้ใน แชท.
Widget callback
 

Dear visitor,

Your IP address shows that you are currently located in the USA. If you are a resident of the United States, you are prohibited from using the services of InstaFintech Group including online trading, online transfers, deposit/withdrawal of funds, etc.

If you think you are seeing this message by mistake and your location is not the US, kindly proceed to the website. Otherwise, you must leave the website in order to comply with government restrictions.

Why does your IP address show your location as the USA?

  • - you are using a VPN provided by a hosting company based in the United States;
  • - your IP does not have proper WHOIS records;
  • - an error occurred in the WHOIS geolocation database.

Please confirm whether you are a US resident or not by clicking the relevant button below. If you choose the wrong option, being a US resident, you will not be able to open an account with InstaForex anyway.

We are sorry for any inconvenience caused by this message.