signal strength 1 of 5
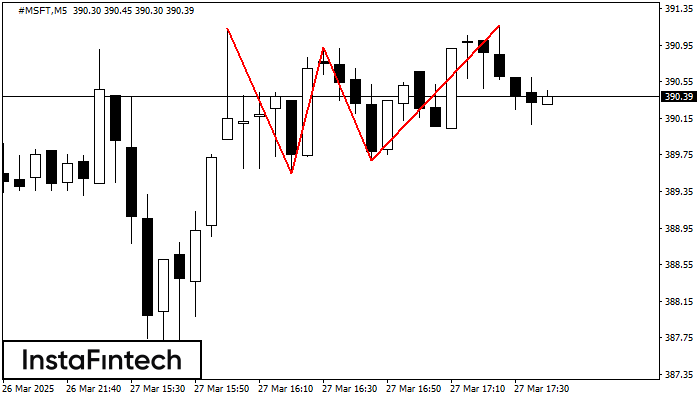
The Triple Top pattern has formed on the chart of the #MSFT M5 trading instrument. It is a reversal pattern featuring the following characteristics: resistance level -3, support level -14, and pattern’s width 158. Forecast If the price breaks through the support level 389.55, it is likely to move further down to 390.77.
The M5 and M15 time frames may have more false entry points.
See Also
- All
- Double Top
- Flag
- Head and Shoulders
- Pennant
- Rectangle
- Triangle
- Triple top
- All
- #AAPL
- #AMZN
- #Bitcoin
- #EBAY
- #FB
- #GOOG
- #INTC
- #KO
- #MA
- #MCD
- #MSFT
- #NTDOY
- #PEP
- #TSLA
- #TWTR
- AUDCAD
- AUDCHF
- AUDJPY
- AUDUSD
- EURCAD
- EURCHF
- EURGBP
- EURJPY
- EURNZD
- EURRUB
- EURUSD
- GBPAUD
- GBPCHF
- GBPJPY
- GBPUSD
- GOLD
- NZDCAD
- NZDCHF
- NZDJPY
- NZDUSD
- SILVER
- USDCAD
- USDCHF
- USDJPY
- USDRUB
- All
- M5
- M15
- M30
- H1
- D1
- All
- Buy
- Sale
- All
- 1
- 2
- 3
- 4
- 5
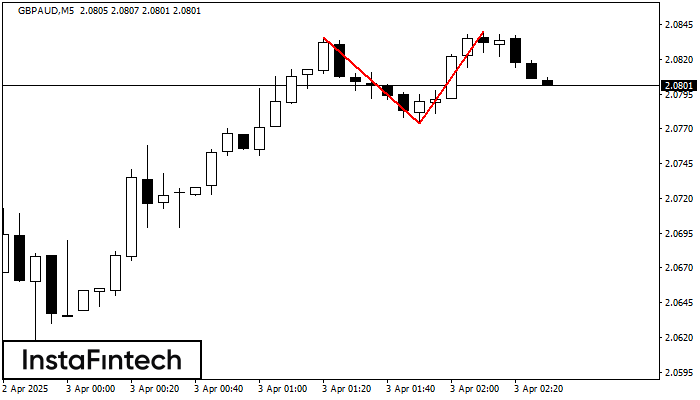
The Double Top reversal pattern has been formed on GBPAUD M5. Characteristics: the upper boundary 2.0836; the lower boundary 2.0774; the width of the pattern is 66 points. Sell trades
The M5 and M15 time frames may have more false entry points.
Open chart in a new window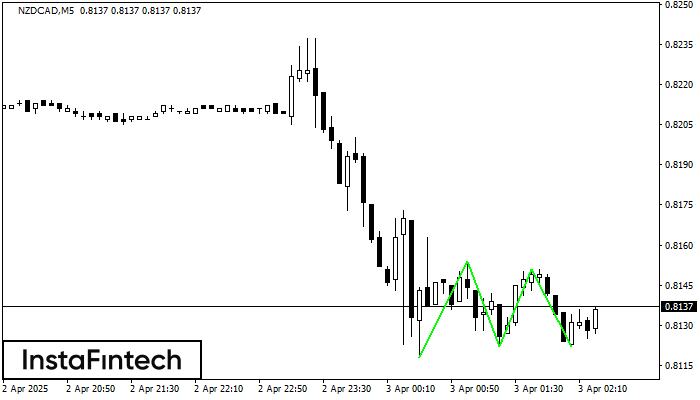
The Triple Bottom pattern has formed on the chart of the NZDCAD M5 trading instrument. The pattern signals a change in the trend from downwards to upwards in the case
The M5 and M15 time frames may have more false entry points.
Open chart in a new window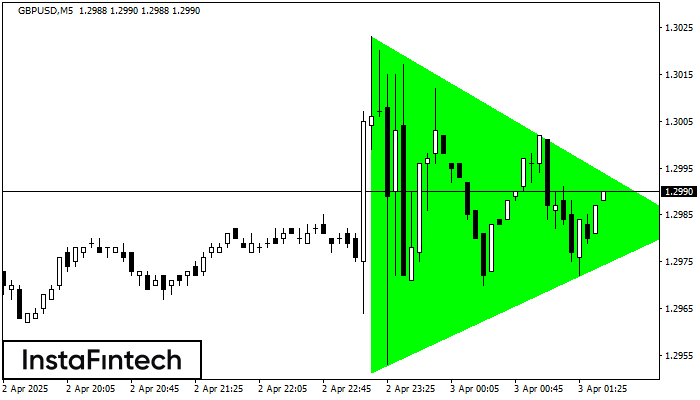
According to the chart of M5, GBPUSD formed the Bullish Symmetrical Triangle pattern. Description: This is the pattern of a trend continuation. 1.3023 and 1.2951 are the coordinates
The M5 and M15 time frames may have more false entry points.
Open chart in a new window