empty
29.01.2024 10:42 AM
EUR/USD and GBP/USD: trading plan for beginners on January 29

Details of economic calendar on January 26

The economic calendar lacked high-impact data on Friday.

Review of charts on January 26

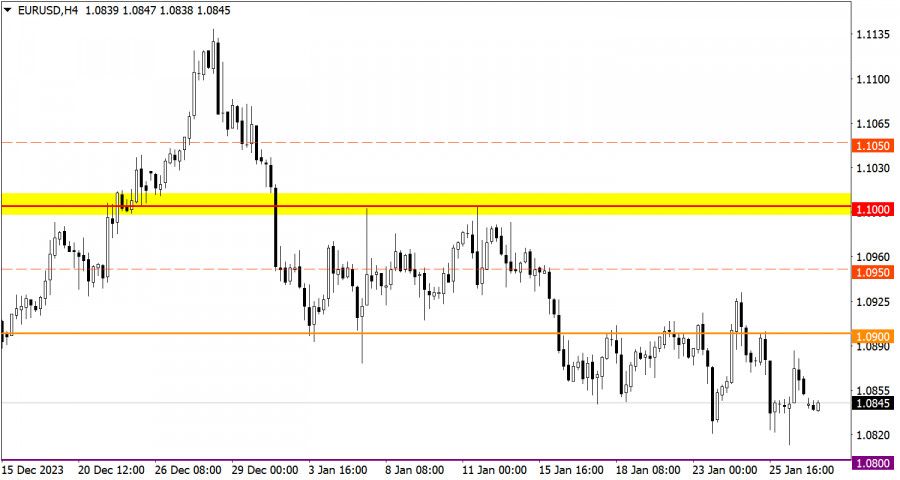
EUR/USD reached the bottom of the correction cycle accompanied by pronounced speculative activity.

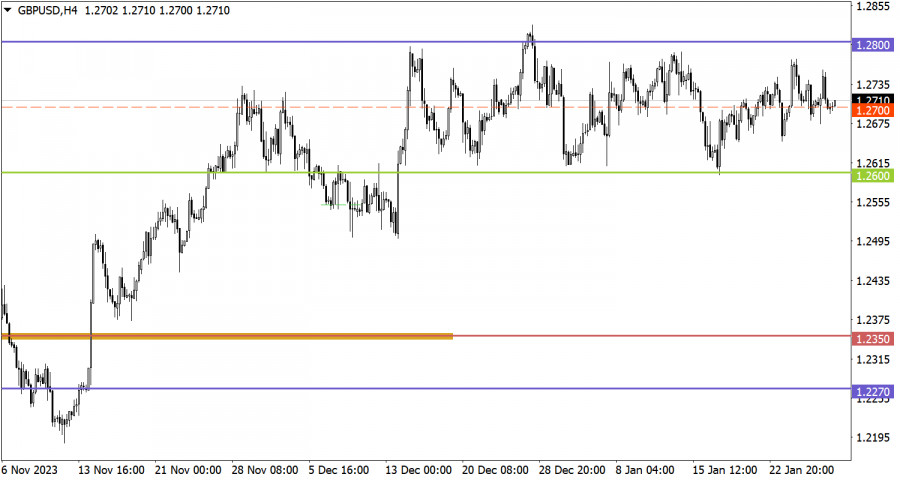
The GBP/USD pair had been trapped within the sideways channel between 1.2600 and 1.2800 for the seventh week in a row. There is periodic speculative activity, but special attention is paid to the middle level of the sideways channel at 1.2700.

This image is no longer relevant

Economic calendar on January 29

Traditionally, the new trading week begins with the empty economic calendar. This is common for Monday. Nevertheless, this week is going to be jam-packed with major events. Two central banks are holding policy meetings. As for macroeconomic data, the market will get to know inflation data for the EU and the US nonfarm payrolls for January.

Trading plan for EUR/USD on January 29

The extension of the downward correction indicates the overall bearish interest among market participants. However, as before, the level of 1.0800 serves as an obstacle for the sellers, which, according to technical analysis, can put pressure on short positions. Thus, the downward cycle is limited to this level, which means some uncertainty in market sentiment. If the price settles below 1.0800 during the day, traders may add short positions.

This image is no longer relevant

Trading plan for GBP/USD on January 29

The median level acts as an indicator of trading interest within the sideways channel. Price stabilization below this level may be followed by a movement towards the lower border of 1.2600. However, all price fluctuations so far fit within the current corridor, which, is still in the making according to technical analysis. A priority strategy among market participants is trading during a breakout of one of the borders of the sideways channel.

This image is no longer relevant

What's on charts

The candlestick chart type consists of graphic rectangles in white and black with lines at the top and bottom. With a detailed analysis of each individual candle, you can see its characteristics relative to a particular time period: opening price, closing price, maximum and minimum price.

Horizontal levels are price coordinates relative to which a price may stop or revered its trajectory. In the market, these levels are called support and resistance.

Circles and rectangles are highlighted examples where the price developed. This color highlighting indicates horizontal lines that may put pressure on the price in the future.

Up/down arrows are guidelines for a possible direction in the future.

Gven Podolsky,
انسٹافاریکس کا تجزیاتی ماہر
© 2007-2025
ٹائم فریم منتخب کریں
5
منٹ
15
منٹ
30
منٹ
1
گھنٹہ
4
گھنٹے
1
دن
1
ہفتہ
انسٹافاریکس کے ساتھ کرپٹو کرنسی کی معاملاتی تبدیلیوں سے کمائیں۔
میٹا ٹریڈر 4 ڈاؤن لوڈ کریں اور اپنی پہلی ٹریڈ کھولیں۔
  • Grand Choice
    Contest by
    InstaForex
    InstaForex always strives to help you
    fulfill your biggest dreams.
    مقابلہ میں شامل ہوں

تجویز کردہ مضامین

یورو / یو ایس ڈی: 15 اپریل کو امریکی سیشن کے لیے تجارتی منصوبہ (صبح کی تجارت کا تجزیہ)

اپنی صبح کی پیشن گوئی میں، میں نے 1.1377 کی سطح کو نمایاں کیا اور وہاں سے تجارتی فیصلے کرنے کا منصوبہ بنایا۔ آئیے 5 منٹ کے چارٹ کو دیکھیں

Miroslaw Bawulski 20:52 2025-04-15 UTC+2

جی بی پی / یو ایس ڈی: 15 اپریل کو امریکی سیشن کے لیے تجارتی منصوبہ (صبح کی تجارت کا تجزیہ)

میری صبح کی پیشن گوئی میں، میں نے 1.3204 کی سطح پر توجہ مرکوز کی اور اس سے تجارتی فیصلے کرنے کا منصوبہ بنایا۔ آئیے 5 منٹ کے چارٹ

Miroslaw Bawulski 20:40 2025-04-15 UTC+2

15 اپریل کو برطانوی پاؤنڈ/امریکی ڈالر کے پیئر کی تجارت کیسے کی جائے؟ نئے تاجروں کے لیے آسان تجاویز اور تجارتی تجزیہ

پیر کی تجارت کا تجزیہ برطانوی پاؤنڈ/امریکی ڈالر کا 1 گھنٹے چارٹ پیر کو، برطانوی پاؤنڈ/امریکی ڈالر جوڑے نے بغیر کسی پریشانی کے اپنی اوپر کی طرف حرکت جاری رکھی۔

Paolo Greco 14:05 2025-04-15 UTC+2

15 اپریل کو یورو/امریکی ڈالر کے جوڑے کی تجارت کیسے کی جائے؟ نئے تاجروں کے لیے آسان تجاویز اور تجارتی تجزیہ

پیر کی تجارت کا تجزیہ یورو/امریکی ڈالر کا 1 گھنٹے چارٹ پیر کو، یورو/امریکی ڈالر کرنسی کے جوڑے نے اوپر کی طرف سے زیادہ تجارت کی، حالانکہ دن کے اختتام

Paolo Greco 14:05 2025-04-15 UTC+2

15 اپریل کو برطانوی پاؤنڈ/امریکی ڈالر کے لیے تجارتی سفارشات اور تجزیہ: پاؤنڈ کو کھڑے رہنے کی کوئی وجہ نظر نہیں آتی

برطانوی پاؤنڈ/امریکی ڈالر کا 5 منٹ کا تجزیہ برطانوی پاؤنڈ/امریکی ڈالر کی کرنسی جوڑے نے پیر کو بغیر کسی "مگر" کے زیادہ تجارت کی۔ جبکہ یورو نے دن کے اختتام

Paolo Greco 13:57 2025-04-15 UTC+2

15 اپریل کو یورو/امریکی ڈالر کے لیے تجارتی سفارشات اور تجزیہ: کوئی بورنگ پیر نہیں۔

یورو/امریکی ڈالر کا 5 منٹ کا تجزیہ یورو/امریکی ڈالر کرنسی کے جوڑے نے پیر کے سیشن کے دوران اپنی ترقی کو بڑھانے کی کوشش کی لیکن آخرکار دن کے دوسرے

Paolo Greco 13:41 2025-04-15 UTC+2

جی بی پی / یو ایس ڈی: 14 اپریل کو امریکی سیشن کے لیے تجارتی منصوبہ (صبح کی تجارت کا جائزہ)

اپنی صبح کی پیشن گوئی میں، میں نے 1.3139 کی سطح کو نمایاں کیا اور اس کی بنیاد پر تجارتی فیصلے کرنے کا منصوبہ بنایا۔ آئیے 5 منٹ کے چارٹ

Miroslaw Bawulski 20:45 2025-04-14 UTC+2

یورو / یو ایس ڈی: 14 اپریل کو امریکی سیشن کے لیے تجارتی منصوبہ (صبح کی تجارت کا تجزیہ)

اپنی صبح کی پیشین گوئی میں، میں نے 1.1393 کی سطح کو نمایاں کیا اور اس کی بنیاد پر داخلے کے فیصلے کرنے کا منصوبہ بنایا۔ آئیے

Miroslaw Bawulski 20:35 2025-04-14 UTC+2

14 اپریل کو یورو/امریکی ڈالر کے جوڑے کی تجارت کیسے کی جائے؟ نئے تاجروں کے لیے آسان تجاویز اور تجارتی تجزیہ

جمعہ کی تجارت کا تجزیہ یورو/امریکی ڈالر کا 1 گھنٹے چارٹ جمعہ کو، یورو/امریکی ڈالر کی کرنسی جوڑا عموماً اوپر کی طرف حرکت کرتا رہا۔ اور کیوں رکے گا؟ امریکہ

Paolo Greco 13:53 2025-04-14 UTC+2

14 اپریل کو برطانوی پاؤنڈ/امریکی ڈالر کے لیے تجارتی سفارشات اور تجزیہ: The Pound – The Silent Leader

برطانوی پاؤنڈ/امریکی ڈالر 5 منٹ کا تجزیہ برطانوی پاؤنڈ/امریکی ڈالر کرنسی جوڑے نے جمعہ کو زیادہ تجارت جاری رکھی، حالانکہ اس بار ڈالر نے کافی نقصان سے گریز کیا۔ اگرچہ

Paolo Greco 13:50 2025-04-14 UTC+2
ابھی فوری بات نہیں کرسکتے ؟
اپنا سوال پوچھیں بذریعہ چیٹ.
Widget callback
 

Dear visitor,

Your IP address shows that you are currently located in the USA. If you are a resident of the United States, you are prohibited from using the services of InstaFintech Group including online trading, online transfers, deposit/withdrawal of funds, etc.

If you think you are seeing this message by mistake and your location is not the US, kindly proceed to the website. Otherwise, you must leave the website in order to comply with government restrictions.

Why does your IP address show your location as the USA?

  • - you are using a VPN provided by a hosting company based in the United States;
  • - your IP does not have proper WHOIS records;
  • - an error occurred in the WHOIS geolocation database.

Please confirm whether you are a US resident or not by clicking the relevant button below. If you choose the wrong option, being a US resident, you will not be able to open an account with InstaForex anyway.

We are sorry for any inconvenience caused by this message.