empty
12.03.2025 10:46 AM
EUR/USD and GBP/USD March 12 – Technical Analysis

EUR/USD

This image is no longer relevant

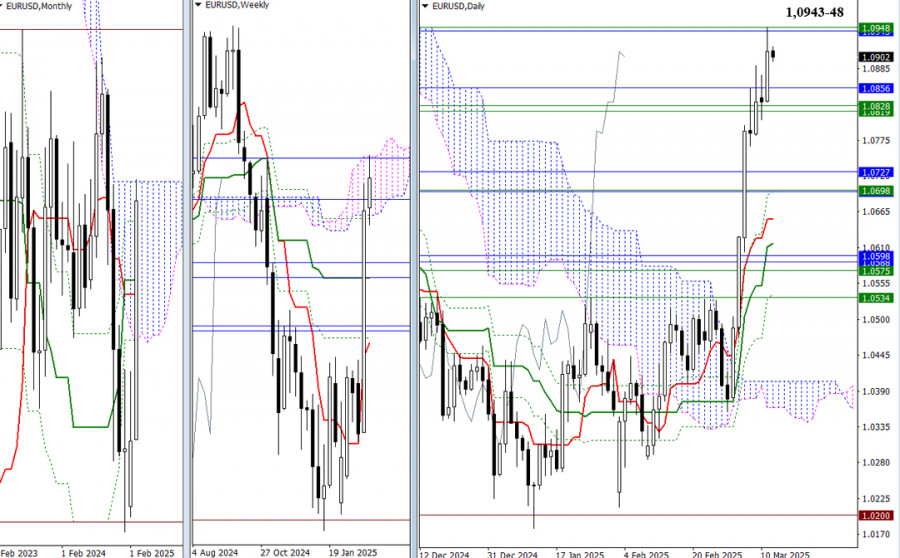
The bulls have successfully broken out of the gravitational zone between 1.0819 and 1.0856, continuing their upward movement to reach the key levels of 1.0943 to 1.0948. Currently, as the pair tests the upper boundaries of the weekly and monthly Ichimoku cloud, a breakout could lead to consolidation in the bullish zone, allowing for higher targets for further gains. However, if the bulls fail to achieve this, the pair may revert to the cluster of levels around 1.0819 to 1.0856.

This image is no longer relevant

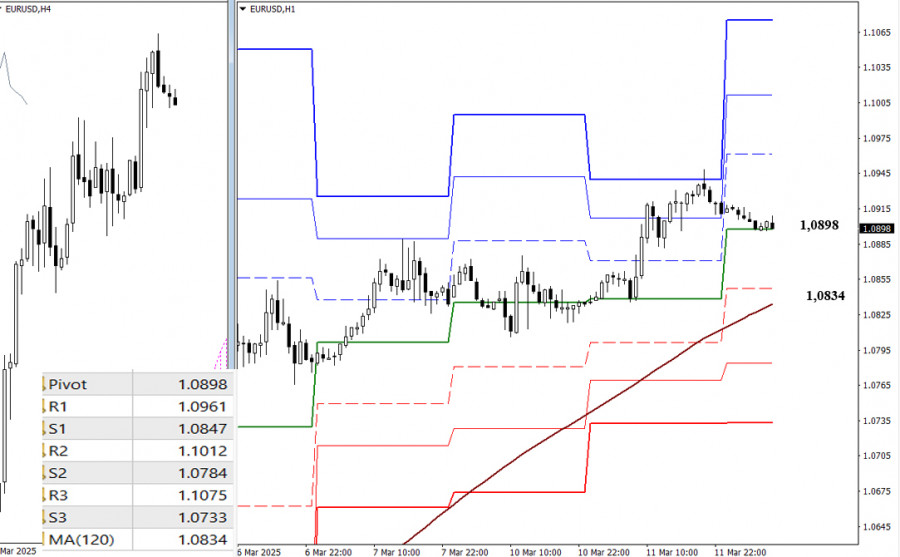
On lower timeframes, the pair is in a corrective zone, testing support at the central Pivot level of the day, which is 1.0898. A break below this level would open the path toward the weekly long-term trend at 1.0834. Should this level be breached and the trend reverse, it could shift the current balance of power. Additional reference points to monitor for further declines include the classic Pivot levels at 1.0784 and 1.0733. If the corrective pullback ends and the bulls regain control, attention will shift back to the resistance of the classic Pivot levels at 1.0961, 1.1012, and 1.1075, which are key bullish targets for the day.

***

GBP/USD

This image is no longer relevant

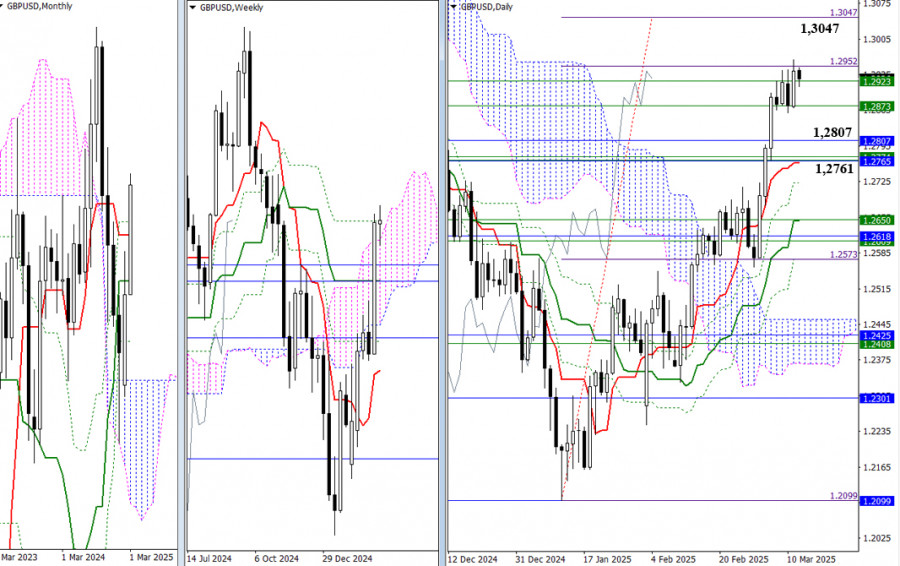
The currency pair is currently testing weekly resistance levels between 1.2873 and 1.2923, along with the first target level for a breakout from the daily Ichimoku cloud at 1.2952. A phase of consolidation and uncertainty is emerging. If the bulls succeed in breaking out of this consolidation zone, their next target will be to reach the 100% breakout level of 1.3047. Conversely, if the bears gain control and push the pair lower, they will first encounter previously tested higher timeframe support levels at 1.2807 and 1.2765, which are reinforced by the daily short-term trend at 1.2761.

This image is no longer relevant

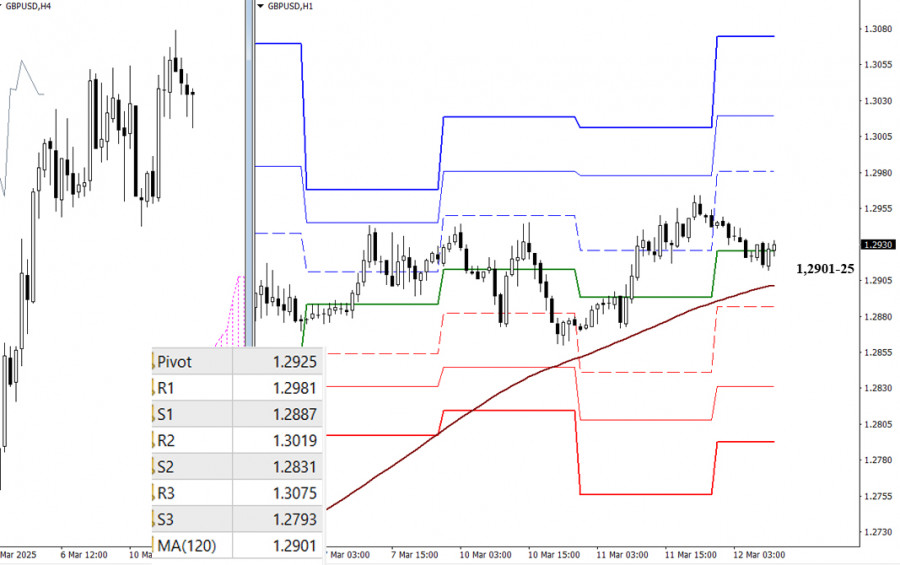
On lower timeframes, during the ongoing corrective decline, the pair is testing key levels at 1.2925 (the central pivot level for the day) and 1.2901 (the weekly long-term trend). A breakout and trend reversal at these levels would give an advantage to the bears. For further downward movement, the pair needs to break through the support of the classic Pivot levels at 1.2887, 1.2831, and 1.2793. If the correction concludes, attention will turn to resistance of the classic Pivot levels at 1.2981, 1.3019, and 1.3075.

***

Technical Analysis Components:
  • Higher Timeframes: Ichimoku Kinko Hyo (9.26.52) and Fibonacci Kijun levels
  • H1: Classic Pivot Points and 120-period Moving Average (weekly long-term trend)
Pilih carta masa
5
min
15
min
30
min
1
jam
4
jam
1
hari
1
minggu
Jana pendapatan melalui perubahan kadar mata wang kripto dengan InstaForex.
Muat turun MetaTrader 4 dan buka dagangan pertama anda.
  • Grand Choice
    Contest by
    InstaForex
    InstaForex always strives to help you
    fulfill your biggest dreams.
    SERTAI PERADUAN

Artikel yang dicadangkan

EUR/USD. 10 April. Trump Terus Menggoncang Pasaran

Pada hari Rabu, pasangan EUR/USD melakukan dua lantunan dari zon rintangan 1.1081–1.1095, beralih memihak kepada dolar AS, dan menurun menuju zon sokongan 1.0944–1.0957. Jika terdapat lantunan dari

Samir Klishi 12:19 2025-04-10 UTC+2

Ramalan untuk GBP/USD pada 10 April 2025

Pada carta setiap jam, pasangan GBP/USD pulih daripada tahap 1.2865 pada hari Rabu, mengalami sedikit penurunan, dan hari ini kembali ke paras yang sama. Satu lagi lantunan daripada tahap

Samir Klishi 12:12 2025-04-10 UTC+2

Analisis Teknikal Pergerakan Harga Intraday bagi Indeks Nasdaq 100, Khamis 10 April 2025.

Berdasarkan apa yang dapat dilihat pada carta 4 jam bagi indeks Nasdaq 100, walaupun terdapat pengukuhan semasa dalam #NDX, perkara ini disahkan oleh pergerakan harga yang berada di atas

Arief Makmur 10:14 2025-04-10 UTC+2

Analisis Teknikal Pergerakan Harian Harga Pasangan Mata Wang Eksotik USD/IDR, Khamis 10 April 2025.

Pada carta harian, pasangan mata wang eksotik USD/IDR kelihatan mempunyai kecenderungan Menaik yang agak kuat, yang ditunjukkan oleh pergerakan harganya bergerak di atas EMA (21), tetapi kerana ia kini tersekat

Arief Makmur 10:14 2025-04-10 UTC+2

USD/JPY: Inflasi AS yang Perlahan Mungkin Memberi Tekanan kepada Pasangan Ini

Yen Jepun jatuh dengan ketara sehari sebelumnya disebabkan berita yang tidak dijangka mengenai penangguhan seketika 90 hari dalam perang dagangan. Perkembangan ini menyokong dolar, tetapi sama ada pertumbuhannya akan berterusan

Pati Gani 09:56 2025-04-10 UTC+2

Ramalan EUR/USD untuk 10 April 2025

Semalam, Presiden A.S. Donald Trump menurunkan tarif kepada 10% selama 90 hari untuk negara-negara yang tidak membalas terhadap tarif awal A.S. (lebih daripada 75 negara secara keseluruhan). Sementara itu, tarif

Laurie Bailey 05:08 2025-04-10 UTC+2

Ramalan GBP/USD untuk 10 April 2025

Pada hari Rabu, pound Britain telah pun melengkapkan keseluruhan julat sasaran 1.2816/47, namun seperti yang dijangkakan, ia gagal untuk bertahan di atas julat tersebut dan sebaliknya memasuki fasa pengukuhan harga

Laurie Bailey 05:08 2025-04-10 UTC+2

Ramalan USD/JPY untuk 10 April 2025

Volatiliti tinggi pasangan USD/JPY semalam gagal mengubah sentimen menurun—badan graf lilin tidak pernah ditutup di atas garis keseimbangan. Penurunan pagi ini hampir sepenuhnya menelan graf lilin putih semalam. Harga kini

Laurie Bailey 05:08 2025-04-10 UTC+2

Ramalan S&P 500 untuk 10 April 2025

Indeks saham AS, S&P 500, mencatat salah satu kenaikan harian terbesar dalam sejarahnya semalam. Ia hanya kekurangan beberapa mata daripada paras sasaran pada 5516.00. Terdapat juga persoalan halus sama

Laurie Bailey 05:08 2025-04-10 UTC+2

Isyarat Dagangan EMAS (XAU/USD) untuk 9-11 April 2025: jual di bawah $3,075 (21 SMA - 61.8%)

Dari segi teknikal, emas telah terlebih jual sejak semalam, jadi kenaikan semula dalam beberapa jam terakhir ini mewakili pembetulan teknikal. Oleh demikian, kami percaya mungkin terdapat pengukuhan di bawah 3,085

Dimitrios Zappas 16:03 2025-04-09 UTC+2
Tidak boleh bertanya sekarang?
Tanya soalan anda di Ruangan bersembang.
Panggilan semula Widget
 

Dear visitor,

Your IP address shows that you are currently located in the USA. If you are a resident of the United States, you are prohibited from using the services of InstaFintech Group including online trading, online transfers, deposit/withdrawal of funds, etc.

If you think you are seeing this message by mistake and your location is not the US, kindly proceed to the website. Otherwise, you must leave the website in order to comply with government restrictions.

Why does your IP address show your location as the USA?

  • - you are using a VPN provided by a hosting company based in the United States;
  • - your IP does not have proper WHOIS records;
  • - an error occurred in the WHOIS geolocation database.

Please confirm whether you are a US resident or not by clicking the relevant button below. If you choose the wrong option, being a US resident, you will not be able to open an account with InstaForex anyway.

We are sorry for any inconvenience caused by this message.