


Signals to enter a position can be obtained in various ways. Some traders use combinations of candles or patterns, while others prefer to use technical tools.
In this article, we will consider one of the ways to determine the price direction and find entry points. We will focus on such a figure as Golden Cross trading and find out how to trade using this pattern.
To learn more about how else you can analyze the market and get signals to enter it, you can read the article "What is trading".
Trend-following indicators
Technical indicators are one of the most often used methods of market analysis. Their advantage is that the analysis is carried out in an automatic mode. The indicators give a signal, and the user makes a decision about opening a position.
One of the most important tasks for the trader is to determine whether there is a directional movement of the asset price. It is called a trend movement or trend.
A trend can be upward, or bullish, which indicates the dominance of buyers in the market. It can also be bearish or downward, indicating that sellers dominate the market.
Most trading strategies are based on trading during such periods when the market has a clear directional movement. That is why it is so important to know if the market is volatile or if it is flat.
There is a special group of technical tools, that is trend indicators, for solving this problem. They can help traders to see the existing situation in the market. However, it is difficult to make predictions about future price behavior.
Besides, a rather significant disadvantage of this category is a lag. Indicators give signals not at the beginning of the directional movement, but with a small delay.
That is why indicators of this group are often used together with other indicators, including oscillators and volume indicators. Such combinations allow traders to determine real and false signals of trend indicators.
Trend indicators do not work well during periods when the market moves sideways. There are a lot of false signals at this time.
Often, the absence of a directional movement can be confirmed by the volume indicators. The fact is that during consolidation, traders take a break, thus causing a drop in the trading volume.
Moving averages
Various technical indicators are used by many traders to analyze the market and find entry points. Indicators perform various functions and are used for different purposes.
Trend indicators are one of the most frequently used indicators. They allow traders to get signals during a clear directional movement.
As we have already mentioned, all trend indicators have one rather serious disadvantage which is a lag. They give signals after the trend movement begins. As a result, traders enter the market with a delay.
At the same time, this feature allows them to open a position, avoiding false signals. A moving average (MA) is one of the most popular indicators in this category.
To draw it, we take the average value of the asset over a certain number of days or periods. For example, if a 50-period MA is drawn, it uses the values of the last 50 periods or days.
Since the line is based on averaged values, it is smoother than the line of the price itself. The longer a period is, the smoother MA will be.
The main functions of the moving average are:
1. Detect a direction of the current trend;
2. Confirm a trend change;
3. Form support and resistance lines.
When the chart is above the moving average it indicates that the market is dominated by bulls, i.e. an uptrend. When the chart is below the moving average, it shows that the market is dominated by bears, i.e. there is a downward trend.
Setting up moving averages
In order to get reliable signals from moving averages, they should be properly set up. This indicator is fully adjustable, that is, all its key parameters can be customized.
As we mentioned earlier, for the drawing of a moving average you can choose any period, that is any number of candlesticks or bars, on the basis of which it is created. The most popular are MAs with periods of 50, 100, and 200.
Small periods are good for short time frames, while larger ones are good for bigger time frames. However, if MA periods are too big, their signals can be delayed.
The fact is that they are based on too old data, which may no longer be relevant at the moment. In this case, they can be used as support or resistance lines.
You can also choose a formula for calculating a moving average. To calculate the SMA, which is a simple moving average, divide the total sum of the asset prices for a selected period of time by the number of periods.
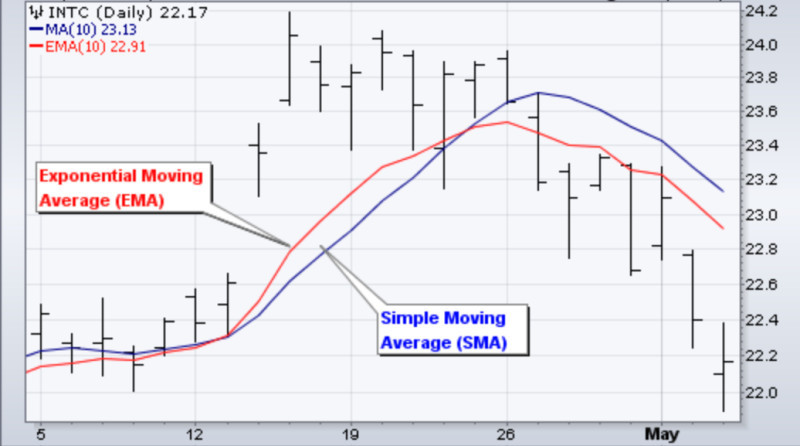
An exponential moving average (EMA) is another well-known type. In its calculation, the focus shifts to the latest data. For example, in the calculation of the 200-period EMA the candles from 1 to 50 have the smallest weight, while candles from 150 to 200 have the biggest weight.
Since the calculation of the EMA relies on more recent data, it can react more quickly to changes in the value. Consequently, many users prefer to use it rather than the SMA.
There are other varieties of moving averages, but they are used by traders very seldom, so we will not consider them in detail.
Moving average signals
Moving averages are used in various trading strategies and can provide a trader with different signals. They can be divided into several groups:
1. Intersection of a price and MA. We have already mentioned that when the MA is under the price chart it points to a bullish trend, and when it is above the chart, the trend is bearish.
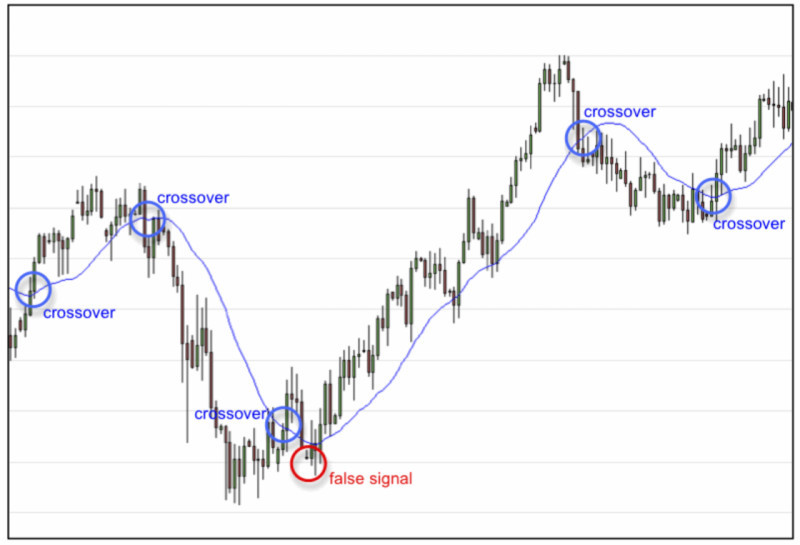
In this situation, the point at which the price chart upwardly crosses the MA gives a signal to open a buy position. Meanwhile, the downward crossing gives a sell signal.
2. Intersection of moving averages with each other is important for periods of strong price fluctuations. This is where the Golden Cross and Death Cross patterns are formed.
3. Intersection of three or more MAs. For example, three moving averages with periods 4, 9, and 18, are intersecting each other. When the 4-period MA upwardly crosses the 18-period MA, it points to the end of the bearish trend.
A signal to open a long position could be received if a 9-period MA crosses an 18-period MA.
4. False signals. They can occur for two reasons. One of them is the absence of a clear trend movement. When the market is flat, signals from the moving averages are likely to be false.
False signals may also occur if there are gaps on the chart, that is, price gaps at the moments of market opening. This is due to the fact that moving averages tend to lag.
What is Golden Cross trading?
We have already found out the basic concepts of MAs and their functions. Now let us see how to figure out the Golden Cross pattern on the chart.
It is formed when two moving averages with different periods overlap. As a rule, for the fast one we choose the value of 50 periods, and for the slow one - 200 periods.
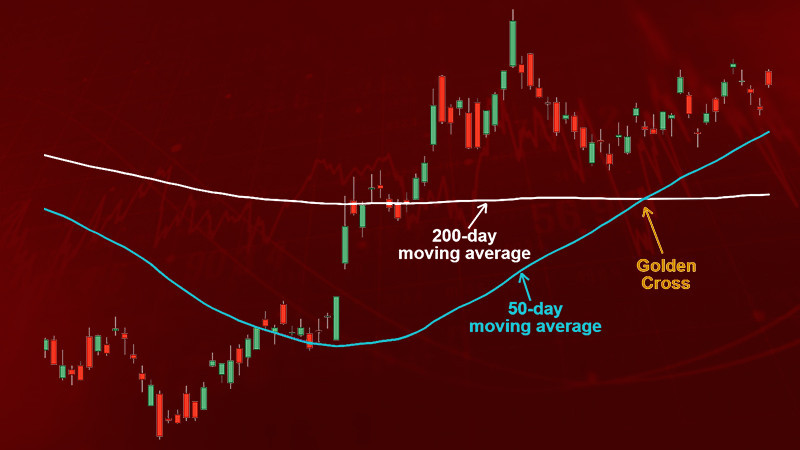
To form Golden Cross, it is necessary that a short-term MA upwardly crosses a long-term one. This pattern is considered a reversal and indicates a change from a downtrend to an uptrend.
The formation of this pattern consists of several stages. We will consider them in detail in this section.
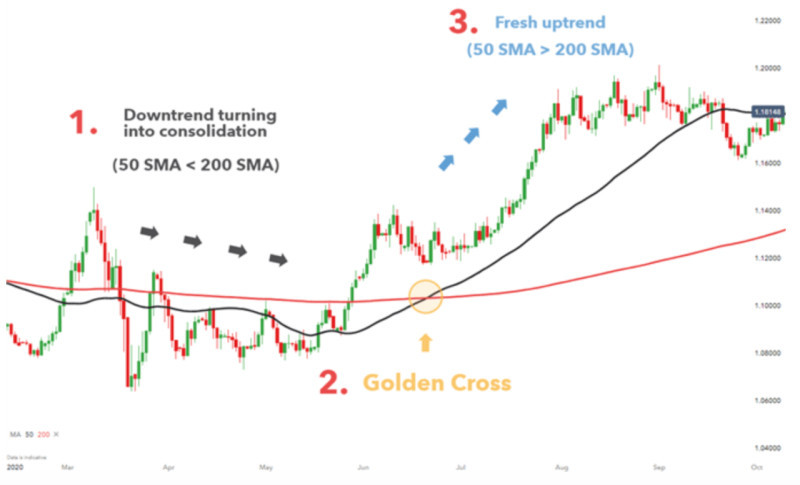
1. The market is bearish. The 200-period MA is located above the 50-period MA.
2. The faster line starts to rise, crosses the slower one, and forms above it. This means a change in the trend from bearish to bullish.
The moment of crossing is a sign of opening buy positions. Then, the short-term moving average becomes more and more distant from the long-term, which confirms the strength of the new trend.
We have already mentioned that trend signals tend to lag. That is why the beginning of a new trend in such a situation is skipped by traders, but the signal is more reliable.
In fact, the formation of Golden Cross marks not the beginning of a new trend but its confident continuation. This can be seen in the numerous examples displayed on the chart.
Golden Cross in trading
Let us find out how to use MAs intersections in trading strategies, including the one based on the application of the Golden Cross pattern. Trading using this pattern is quite common among users.
However, there are a number of important features to be considered to assure the successful application of strategies with overlapping MAs.
Firstly, it should be remembered that such tools are effective only during a clearly defined trend. Once the chart is in the consolidation phase, MAs produce a large number of false signals.
Secondly, pay attention to the time frames used for trading. In lower periods, there may be more signals, but the signals received in higher periods are considered to be more reliable.
Even if positions are opened on small time frames, it is worth checking the signals on a bigger time frame. On bigger time frames, it is possible to see a more complete picture of what is happening in the market.
Therefore, this model is often used by traders who prefer long-term and medium-term trading. To use it in short-term strategies, especially in scalping, is rather difficult.
Thirdly, find a confirmation of the signal received after the formation of Golden Cross. One of the ways of confirmation is to monitor the trading volumes.
Typically, the signal is confirmed by an increase in the trading volume at the time of the pattern formation. This indicates that the signal of the price reversal is reliable.
In addition, you can use other technical indicators or graphic patterns to confirm signals. For example, you can look for candlestick combinations or reversal patterns on the chart.
What is Golden Cross in trading?
We have already talked a lot about the Golden Cross pattern and it is clear that it is not perfect. So, how can you improve its signals and your trading strategy based on this pattern?
There are several ways to improve your trading strategy by adding some additional elements to it. Let us take a closer look at them.
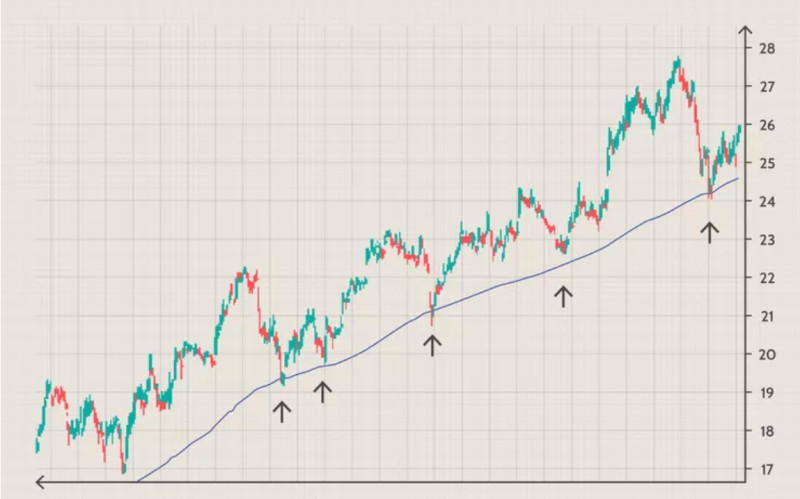
1. Enter the market after a pullback during an uptrend and not immediately after the Golden Cross pattern formation. This strategy allows you to enter the market at a more favorable price.
However, a trader may miss the most profitable moment to open a position. It may happen that after the pullback, the price will stop rising.
Nevertheless, such a strategy gives more confidence to traders and allows them to make a profit.
2. Search for confirmation signals with the help of graphical patterns. There are the most known and frequently forming patterns, the formation of which indicates a change in the current trend.
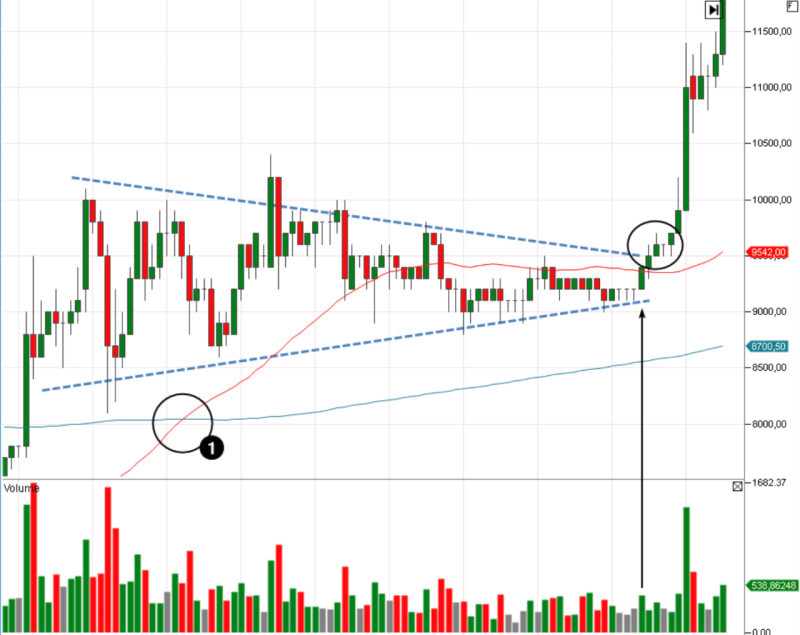
It so happens that Golden Cross is formed at a time when the market is still in a period of consolidation. It means that the price is hovering within a particular channel.
If you open a trade just after the appearance of this model, you may miss a bigger opportunity, which will appear after the price breaks the channel in which it was moving. It is possible to predict a breakout by finding a reversal pattern on the chart.
3. Confirm signals using oscillators. For example, you can overlay the RSI indicator with a period of 14 on the chart. Once the Golden Cross pattern is formed, it is necessary to wait for the RSI curve to fall below the 50% mark.
When the indicator line rises above 50% again, it is a sign to open a long position. A take-profit order can be set at the point where the RSI is out of overbought territory (70%).
Who chooses Golden Cross
In general, the Golden Cross pattern is suitable for any trader. For beginners, it is convenient because it is easy enough to use, and the interpretation of its signals is also quite clear.
In addition to the division of users into beginners and experienced, there are other classifications. According to one of such classifications, trades can be divided into three main categories:
1. Those who prefer short-term strategies. This group includes traders who open e a large number of short positions lasting from several seconds (scalping) to several hours (intraday trading);
2. Mid-term traders. This group includes traders who keep their trades open from a few days to a few weeks;
3. Long-term traders. They are also called position traders. They keep their trades open from several weeks to several months.
There are also investors. They do not profit from the fluctuations of an asset price. They invest in assets, expecting that they will increase in value in the future and that they will be able to sell them more profitably.
In addition, investors who purchase stocks and other securities may get dividend payments from issuing companies and some other rewards.
So in what trading strategies can the Golden Cross pattern be used? This pattern is suitable for long-term traders and investors. There is a number of reasons for this.
The key reason is that traders who prefer short-term strategies use short time frames. On such time frames, the pattern gives a lot of false signals.
At the same time, users who prefer long-term trading and investing choose bigger time frames. Signals from the Golden Cross pattern are considered to be reliable on long time frames.
Advantages and disadvantages of Golden Cross
Like any other trading tool, the Golden Cross pattern has both advantages and disadvantages. We will consider them in more detail.
Let us first examine the advantages of using this pattern:
- Profitability. It shows good results when there is a clear directional movement in the market;
- Versatility. It can be applied to any time period and to any asset;
- Ease of use. This model does not have any complicated settings or methods of signal interpretation. That is why it can be used even by beginners;
- Availability. Moving averages are included in the standard set of all modern trading platforms. It is a basic analytical tool, which may be used by all traders.
The disadvantages of using this pattern are:
- Lagging is the main disadvantage of all trend indicators. To neutralize it, you can use other indicators, such as oscillators;
- The probability of losing part of the profit during a reverse. Since the signal is delayed, a user may not be able to open a position at the beginning of the directional movement. Accordingly, by the time the position is opened, the trend can make a reversal. This can be avoided by using additional tools for the confirmation of signals;
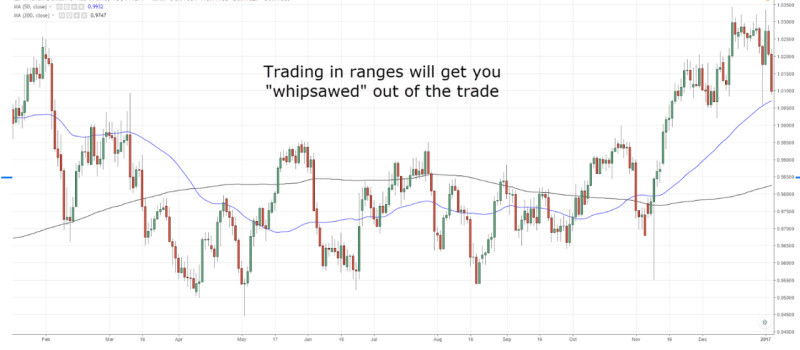
- False signals. Under certain conditions, the pattern may produce a large number of unreliable signals. As a rule, it may happen in two situations: during the sideways movement or when using short time frames.
How to apply
To make sure that trading with the pattern brings profits, it is necessary to follow a number of rules. We have tried to collect them in this section to make it clear how to use the Golden Cross pattern in trading.
1. Apply this pattern only during a clear directional movement. When there is a period of consolidation in the market, Golden Crosse trading may appear more often. However, signals are very likely to be false.
2. When setting up moving averages, follow the rule: the longer the trend that should be determined is, the longer the period should be set for MA. The shorter the analyzed period is, the smaller period should be set for the moving average.
3. Use a classical combination of moving averages for this pattern: fast with a period of 50 and slow with a period of 200. These values are considered standard, and their effectiveness and reliability have been tested over time.
4. When we choose sufficiently large moving averages with periods, including 50 and 200, we must understand that we are talking about global changes in the value, which occur not in a single moment but over several months.
5. Nevertheless it is not forbidden to experiment and change the settings of moving averages, taking into account your trading algorithm, time frames, and other parameters.
6. Look for confirmation of the Golden Cross signal with the help of other technical indicators, candlestick combinations, or patterns on the chart. Volume indicators as well as oscillators can be used for this purpose.
7. Use protective orders. To set a stop-loss level, use a local low on the chart, from which the upward trend actually began. To set a take-profit level, apply the following crossing of the moving averages, only in the opposite direction.
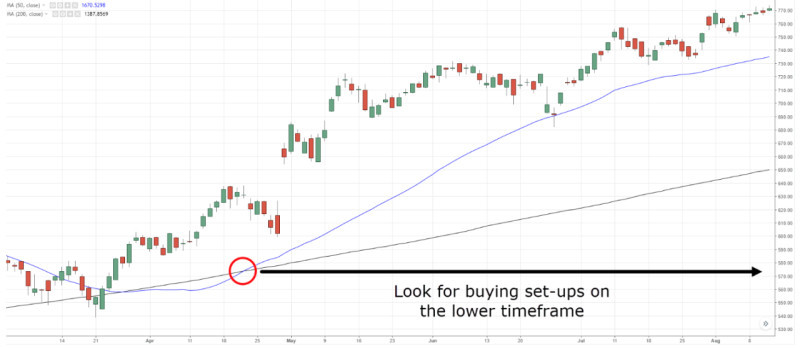
8. If you prefer to trade on lower time frames, check the signal and overall picture on a longer time frame.
9. Be aware of the lagging tendency of moving averages. That means that you will not be able to enter a position at the very beginning of a trend movement if Golden Cross is formed. However, the entry will be more reliable as the trend will already be established.
10. It is also possible to enter the market until the price pulls back. Once the correction is over, the price will continue its upward movement.
11. It should be understood that the trend indicators, in particular, Golden Cross, can not predict the duration of the bullish trend. It is necessary to enter the market, being sure that the current trend will continue.
Meaning of cross in trading
When two moving averages with different periods intersect each other, they indeed form a kind of cross on the chart. However, such crosses can give different signals.
In addition to Golden Cross, an inverse combination, Death Cross, can also be formed on the chart. The appearance of this model indicates a change in the downward trend.
Two moving averages are also involved in the formation of this pattern: a fast one with a period of 50 and a slow one with a period of 200. Here, we should also wait for the first one to cross the second one.
However, unlike Golden Cross, the crossing should be downward. In this case, you can observe several pattern formation periods:
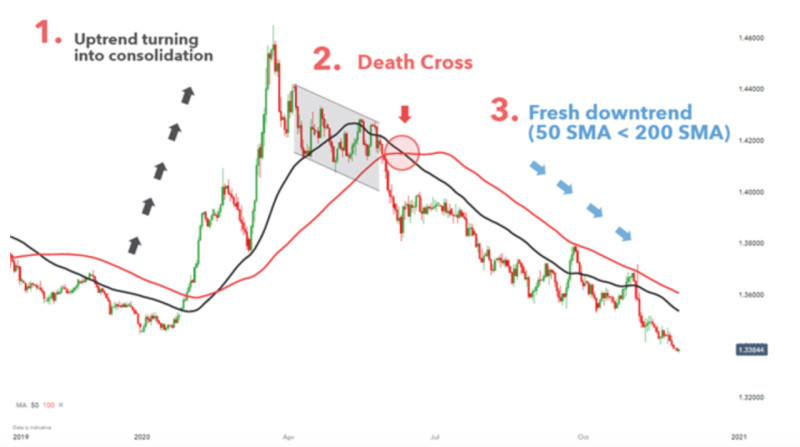
1. The market is dominated by the uptrend, if the fast moving average is located above the long-term trend;
2. At a certain moment, the price reverses, the 50-period MA downwardly crosses the 200-period MA and forms the Death Cross pattern;
3. The downward trend is getting stronger, the fast moving average is positioned below the slow one, and the distance between them increases.
The formation of this pattern is a signal to open sell orders or to close buy orders, which were opened after a signal from the Golden Cross pattern. These patterns are always together: a trader may open a position by one of them and close the position by the second one.
However, it should be remembered that the delay is also a feature of the Death Cross pattern. Therefore, it is worth confirming the presence of a signal with other indicators or waiting for a pullback.
Other MAs combinations
As mentioned, moving averages can form various combinations. The Golden Cross and Death Cross patterns are just some of them. MAs can also be used to create new indicators.
Bollinger Bands is an indicator, which is formed by three moving averages, the center of which is taken as zero, whereas the other two are with deviations -20 and +20 from it.
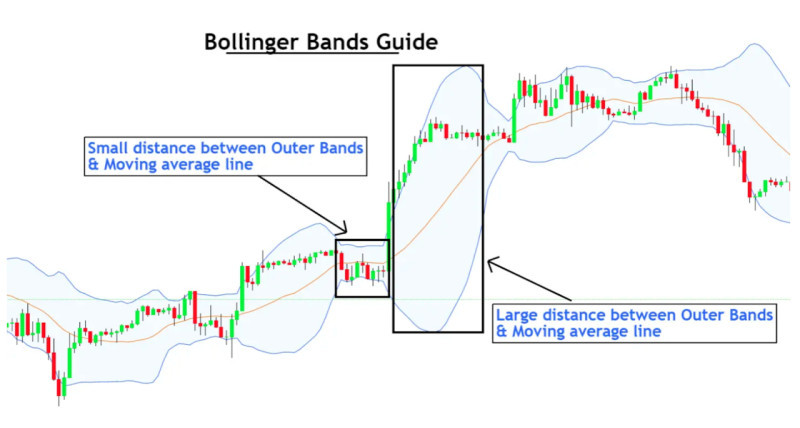
Thus, the upper and lower limits act as dynamic support and resistance levels and form a kind of channel, inside of which the price moves.
By the shape and width of this channel, you can determine the current state of the market. When the lines get closer and the channel narrows, it indicates a sideways movement of the price. When the lines are moving away from each other, it indicates an increase in volatility and the beginning of a trend.
Bill Williams' Alligator is an indicator that also consists of three MAs, forming so-called jaws (13-period MA), teeth (8-period MA), and lips (5-period MA).
When lines diverge in different directions, i.e. alligator's "jaws" open, it indicates a directional trend movement of the price.
When all three lines converge at one point, i.e. the "jaws" are closed, it means the end of the current trend movement and the start of consolidation or a new trend.
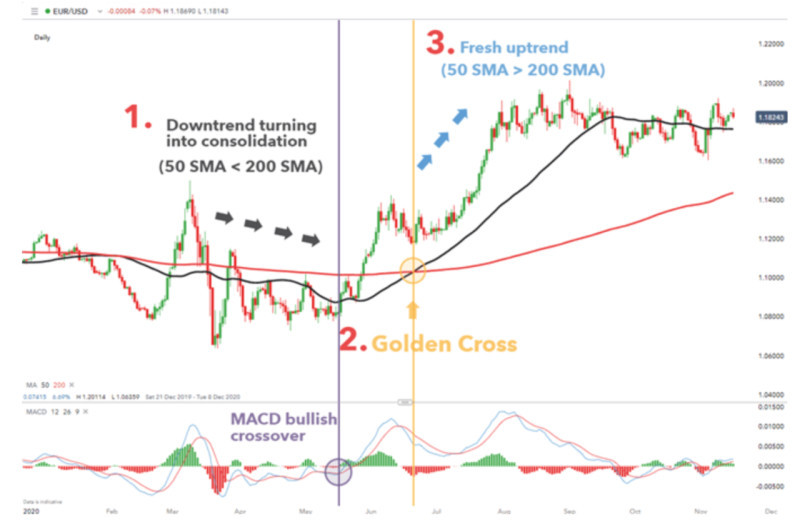
MACD is a composite indicator combining the features of both a trend indicator and an oscillator. It is used for assessing the strength of the dominant trend in the market.
Two lines are used to obtain signals from this indicator which are the MACD line itself and the signal line. It is the interaction of these two lines that gives signals to open trades.
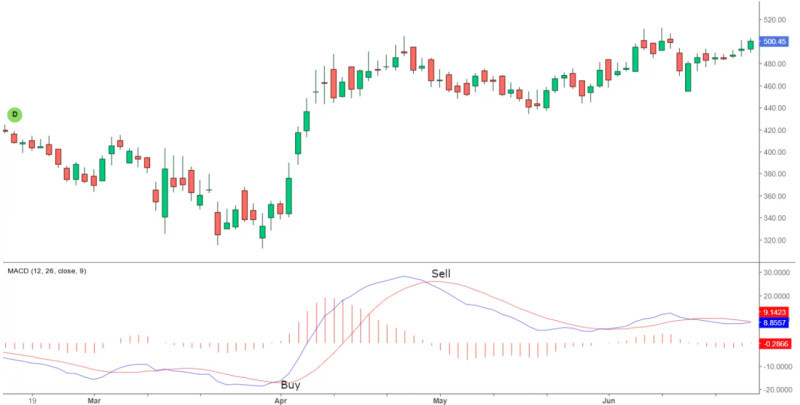
When the MACD line upwardly crosses the signal line, this is a signal to open a buy order. When the MACD line downwardly crosses the signal line, it signals an opportunity to open a sell position.
Conclusion
In this article we have considered the main features of the Golden Cross pattern and trading with its use. This pattern is formed by two moving averages with different periods.
An important signal for a trader is the upward intersection of these MAs. This pattern indicates a change in the trend from bearish to bullish.
More precisely, taking into account the lag of trend indicators the pattern confirms the continuation of a trend instead of showing its beginning. This is both a positive and a negative feature of Golden Cross trading.
It is an advantage because, at the time of the pattern formation, the trend has already been established, respectively, signals to open a buy position are more reliable. It is a disadvantage because traders miss the moment of the best entry into the position at the beginning of the trend.
Signals from the Golden Cross pattern are considered more reliable on long time frames and in periods of a clear directional price movement. This pattern does not work well in low time frames and during periods of consolidation in the market.
Nevertheless, it is recommended to look for confirmation of the signals with the help of other tools. These may be graphical patterns indicating a reversal.
Also, oscillators and volume indicators work well with MAs. For example, during a period of consolidation, trading volume decreases and after the end of the flat movement, the volume starts to increase sharply.
You may also like:
Standard deviation trading strategy


