


There is a common belief that the chart of price moves contains comprehensive details for technical analysis. For this reason, some traders do not apply any extra tools but rely on the chart as such. The thinп is that candlesticks are frequently clustered in various patterns on the chart. Some of them indicate that the ongoing overall trend is expected to continue, while others signal a trend reversal. We will consider one of the popular technical patterns in this article.
You can learn more about other ways of analyzing the market and trading methods by reading the article "Everything about trading".
What Triangle means on chart
Technical patterns are popular among traders as they are quite simple to use. They are also easy to recognize on the chart and interpret. This article expands on the triangle pattern, trading with its application.
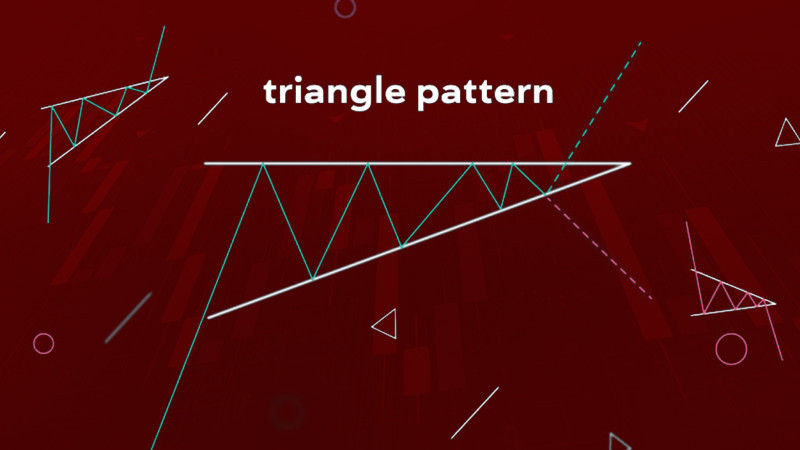
The triangle is considered to be one of the most known patterns. It represents a range that tends to narrow. In this channel, the asset’s price makes a so-called sideways movement.
The lines that bound the triangle are drawn along two local borders on the chart. Two highs are used to build the upper border and two lows are used to build the lower border. Thus, we get two levels, from which the price is repelled.
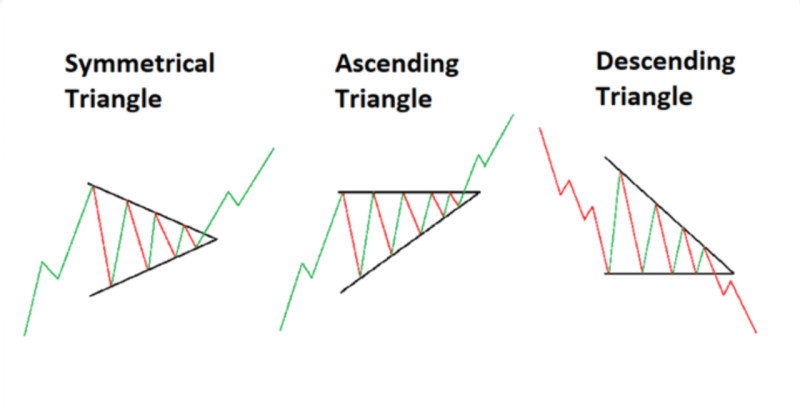
There are three main types of triangles:
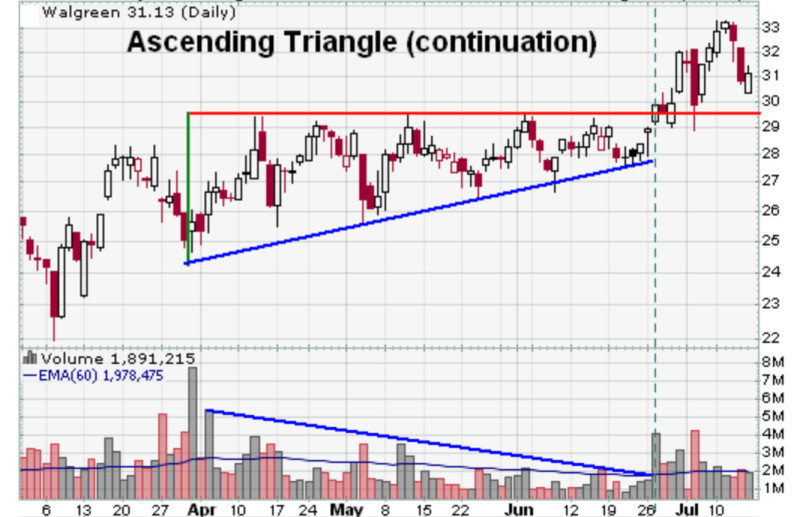
1. Ascending or bullish. The level of lows gradually increases in the pattern. This indicates the end of the uptrend and the beginning of a profit-taking period by major players.
At this time, the market has entered a consolidation stage, during which the price moves within the established range. As a rule, after the sideways period is over, the price carries on with its upward move.
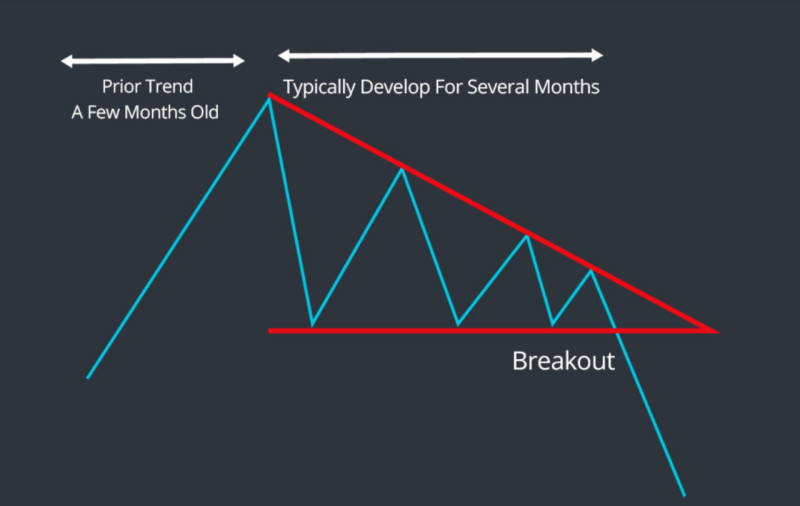
2. Descending or bearish. In this case, the price gradually plots lower lows. This indicates that buyers are trying to turn the tide with the overall downtrend.
As long as the price moves inside the pattern, the market is flat. After its completion, the price will most likely continue its bearish movement. The amplitude of fluctuations becomes narrower as the price approaches the moment of breaking a border.
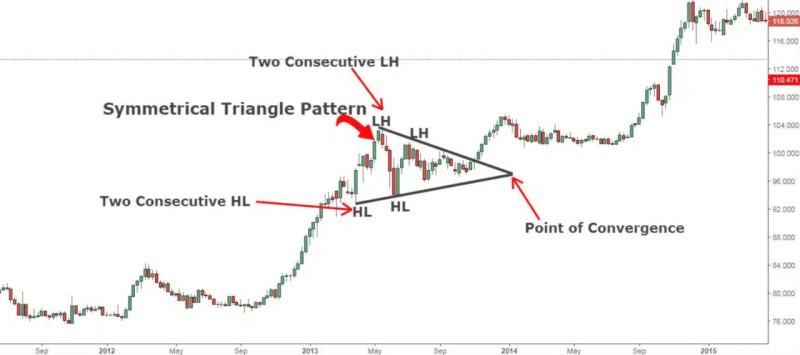
3. A symmetrical or isosceles triangle is formed when both lines are drawn at an angle and tend to "towards" each other. After a period of consolidation, a breakout of this pattern can occur in one or the other direction.
The formation of the pattern under consideration, as a rule, takes a fairly long period of time. However, it is possible to see a narrowing trend in advance and use this to predict a further price move.
How to apply Triangle in trading
Now let's see how you can use this pattern in trading. Speculators with different skills and experience may benefit from the triangle pattern in trading.
One of the trading methods is trading inside the range. This is not very simple and is not suitable for everyone since the price fluctuations inside the triangle are quite small and get subdued as they approach the breakout moment.
The easiest and commonly used trading strategy using this pattern is breakout trading. There are several ways of trading this way.
1. A cautious method involves opening a trade after a breakout and retesting a new support or resistance line. Many traders consider it too risky to open positions immediately at the breakout point because it can be false.
Several factors influence the reliability of a signal during a breakout: the direction of the breakout, the number of candles formed outside the pattern, and the selected time period.
2. Search for entry points before the price breaks through one of the sides of the triangle. This method is considered more aggressive, as it carries more risks, but it can also provide more profit.
When using this strategy, it is important to have good risk management skills since there is always a danger that the price, instead of making a breakout, will again bounce or dip off the border and continue to move in the range.
To manage risks, traders usually set protective orders. As a rule, with a conservative strategy, a take-profit order is set at a level equal in height to the most full-fledged pattern.
When using more aggressive methods, a position is opened even before the breakout, so a take profit can order be set at the point where the price intersects with one of the lines of the pattern.
A stop loss is set on the opposite side of the expected breakout just below one of the boundaries (depending on the type of Triangle).
How market behaves after Triangle shows up
Each type of the Triangle in question is worked out differently on the chart. Thus, accordingly, you need to apply different methods to use them in trading.
The most ambiguous and at the same time universal pattern is a symmetrical triangle. When it is shaped, both borders are located at an angle and tend to meet each other.
Sellers, for their part, put pressure on the price and try to push it down from the resistance level, while the buyers try to push it up from the support level. As a result, one of the parties turns out to be stronger. Hence, a breakout occurs in that particular direction.
At the same time, the instrument "collects" protective and pending orders, which are pre-set by traders. You need to enter the trade in the direction of the breakout and only after the close of the next candle outside the pattern.
If the breakout occurs in an upward direction, this is a signal to buy. At the same time, a stop loss must be set inside the pattern at the nearest low to the breakout. Besides, a take profit is should be roughly equal to the height of the largest wave in the triangle.
If the breakout occurs in a downward direction, this is a sell signal. In such a situation, a stop loss is placed behind the high nearest to the breakout. The largest wave is also the level for profit taking.
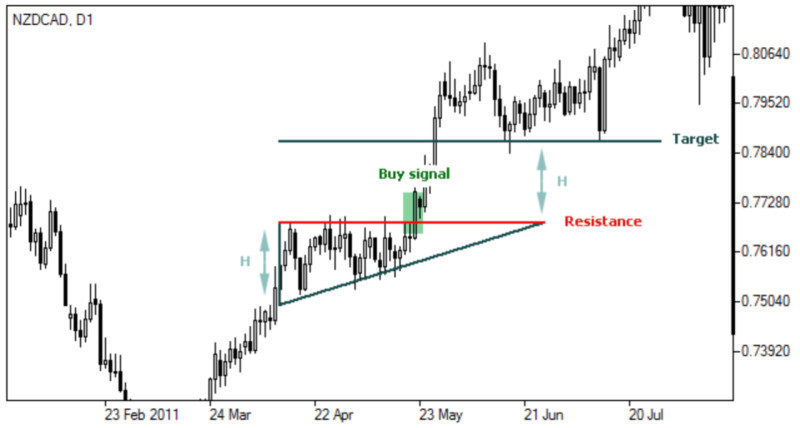
An ascending triangle often indicates a continuation of an uptrend, but there are also developments in the opposite direction. Buyers face a strong resistance level and cannot overcome it for some time.
However, at some point, the bulls break through the level from the bottom up. When using this pattern, a stop loss is recommended to be set below the nearest low inside the triangle. A profit-taking point is equal to the height of the largest wave of the pattern.
Likewise, the bearish triangle is considered a pattern for a further downtrend, although there are also developments in the opposite direction. Sellers are facing a strong support level that they can't break right away.
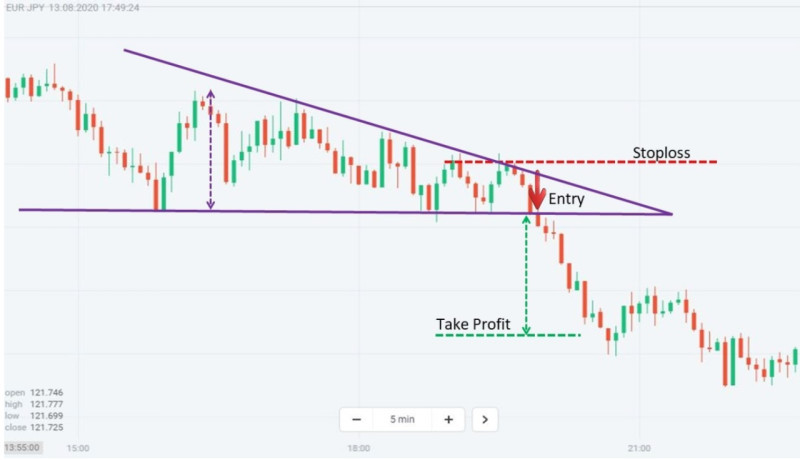
However, after several attempts, they still manage to break through in a downward direction. The stop loss level is set slightly above the nearest local high. A take-profit order should be placed at the level of the largest wave of the triangle.
What Triangle implies in trading
The appearance of a triangle pattern on the chart, trading on its signals can give the user some understanding of what is happening in the market at the current moment.
The symmetrical triangle pattern is one of the most uncertain. Its appearance indicates that the balance between sellers and buyers is approximately equal. Therefore, a breakout can occur in both directions.
However, it is believed that a breakout is more likely to happen in the direction of the previous overall trend than in the opposite direction. Therefore, it is not recommended to enter the market against the trend.
When trading on a symmetrical triangle, it is better to enter a trade only after a breakout has occurred. Positions are opened in the direction of the breakout: if the price passes through the upper line, a buy trade is opened, if the lower one, a sell trade.
The formation of a bearish triangle indicates that the bulls are losing their dominance in the market and the bears, on the contrary, are asserting strength. The breakout point of the lower line of the pattern confirms the strengthening of sellers and, as a rule, is confirmed by a strong market movement.
A bullish triangle is formed during a period when sellers are losing strength and buyers are beginning to gain it. Just like with the descending triangle, the victory of the bulls is confirmed by a breakout of the upper line and strong momentum.
There is another pattern that is less common: this is a divergent triangle. Its top is at the beginning of the pattern, and the lines diverge away from it. This pattern is more difficult to work out than all the previous ones.
It is quite difficult to talk about a breakdown here, so trading can be carried out within the pattern itself. Volatility only increases as the pattern shapes. As a rule, this pattern indicates the continuation of the previous trend.
How trading signals confirmed
We have already mentioned that trading using the triangle pattern can be quite successful if you choose the right entry points for your positions. The search for entry points is always linked with the trading strategy of each individual speculator.
However, it is always helpful to check your conclusions for the correctness of the trading signals generated by the pattern by means of other analytical tools.
This can be tricky because triangles don't play well with technical indicators. The exception is volume indicators.
When the price moves inside the pattern, there is a significant decrease in trading activity on the market. However, right before the price makes a true breakout, a trading volume rises sharply.
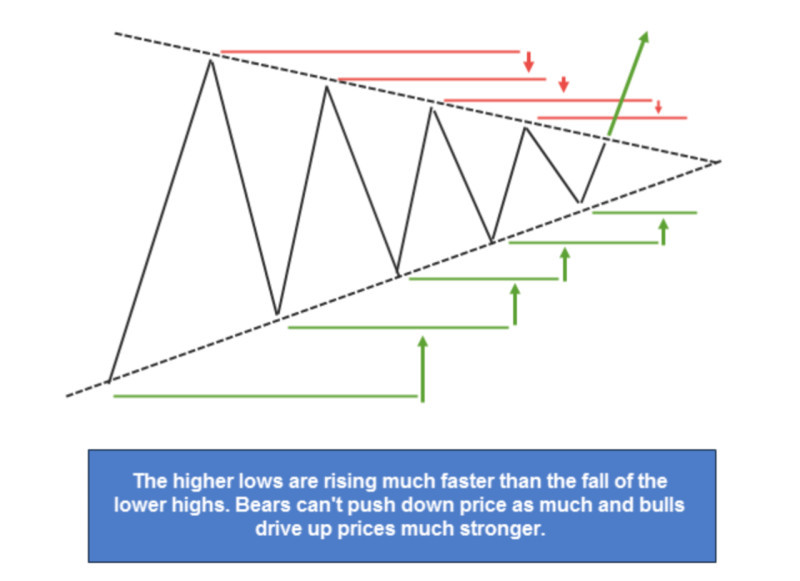
It is also important to pay attention to the number of price fluctuations inside the triangle. In a correctly formed pattern, there must be at least five “waves”, but there may be more. But it is believed that their number should be odd.
It is common knowledge that more accurate signals can be obtained by matching the trend preceding the formation of the pattern and the type of the pattern itself. For example, an uptrend is accompanied by a bullish triangle and vice versa, a downtrend is accompanied by a descending triangle.
Conversely, a signal is considered weak if a bearish pattern is formed while an uptrend is still unfolding or an ascending triangle is formed while a downtrend is still going on.
This is due to the fact that in this case positions are opened against the current trend. Therefore, it is highly recommended to receive not one, but two additional signals.
Like with many other technical patterns, it is better to choose longer time frames to get more reliable signals.
How to plot Triangle on chart
For any graphical pattern, it is essential to recognize it and impose it on the chart. A correctly plotted triangle pattern ensures trading with high-quality signals.
If the pattern is plotted incorrectly, the market could be interpreted in an ambiguous or wrong way. Therefore, it is important to choose the right points for plotting a pattern and connect them together.
The formation of the pattern in question should be preceded by a clear directional movement of the price up or down. This is one of the prerequisites for the correct construction of the pattern.
So, to build each line, you need to find two extreme points on each side. We need two maximum values and two minimum values. Being combined, two borders of the triangle are figured out.
When building a bullish pattern, the resistance line is plotted horizontally, since the peaks are approximately at the same level. The support level is up as the lows gradually get higher and higher.
When building a bearish pattern, the support line is drawn horizontally, since the local lows are at the same level. The resistance level is downward as the highs gradually become lower and lower.
If the lines drawn by two extrema really converge, then the pattern is built correctly. So, you can look for potential points to open a position in accordance with your trading strategy.
If the triangle pattern is built correctly, approximately five waves are formed before the breakout point. For a more vivid representation, you can imagine this pattern as a spring that is compressed more and more, until finally there is a sharp "unclenching".
Pros and cons
Like any other analytical method, the use of a triangle pattern in trading has both its positive and negative sides. Let's explore them in more detail in this section.
The strengths of this pattern include:
• Easy use. The pattern under consideration is quite simple to use and gives fairly unambiguous signals to the trader. An ascending triangle prefaces a further uptrend. Alternatively, a descending pattern means a downtrend.
• Versatility. This pattern can be found on charts of any financial instruments both on Forex and in the stock market, crypto and commodity markets;
• The formation of a pattern can occur at any timeframes, both larger and smaller. Due to this feature, some traders use this pattern in short-term strategies;
Among the key disadvantages of this figure triangle are the following:
• Long process of formation. As we already mentioned, it takes a long time for the Triangle pattern to come into being before the trader can grasp a good opportunity to enter the market. Therefore, it is recommended to use pending orders in order not to miss good opportunities;
• Similarity with other technical patterns. The Triangle pattern is similar to the Wedge pattern, so they can be quite easily confused at the formation stage. However, you should not worry too much about this, as both models belong to the category of trend-following patterns;
• A symmetrical Triangle may give ambiguous signals to the user. The trader could encounter difficulties since after its formation the price can go both up and down.
Rule of using Triangle pattern
With the use of the Triangle pattern, trading can be very successful. However, it is necessary to follow a number of simple rules and recommendations. We have tried to collect them for you in one section.
1. The formation of this pattern occurs after a period of clearly defined directional movement of the price. If such a movement is not observed on the chart, the figure triangle may be false.
2. Make sure the pattern is drawn correctly. A Triangle pattern should be plotted according to all the above criteria. In this case, you can count on the correct working out of the pattern.
3. For more reliable signals, choose larger timeframes. It is common knowledge that there is a lot of price "noise" on smaller timeframes, so false signals may be produced. Patterns that show up on larger timeframes are considered more reliable.
4. In addition, when trading on larger timeframes, the user has more time to analyze and make trading decisions. You can concentrate on choosing a good point to enter positions.
5. Choose for yourself a more aggressive or conservative strategy, depending on your personal traits. The conservative way to enter a trade is more reliable.
6. If you still prefer aggressive methods, we recommend using protective orders. In this case, you will be able to minimize your losses if the price does not move as you expected.
7. Do not strive to execute a large number of transactions. It is better to limit yourself to about ten transactions per month. In this case, you can better prepare for each of them and gain a good profit.
8. Be patient. The formation of a Triangle pattern can take quite a long time: from 1 month or more. However, the wait is worth it because with the correct formation of this model, the trader can find a really good point to open a position.
Conclusion
In this article, we examined some aspects of the formation of a Triangle pattern on the chart, its types, advantages and disadvantages, as well as the rules and specifics of use.
This pattern belongs to the category of trend-following patterns. An ascending Triangle indicates the continuation of the bullish trend, and a descending triangle indicates a bearish one.
The interpretation of a symmetrical triangle can cause some difficulties since after its formation, the price can continue to move both in an upward and downward direction.
The strengths of this model are ease of use and versatility. Weaknesses include a long period of formation and similarity with some other technical patterns.
Despite the fact that the figure triangle can be applied to any timeframes, it is recommended to use larger timeframes for greater reliability of trading signals. For this reason, this pattern is quite difficult to apply in short-term strategies, especially scalping.
Trading can be carried out in two ways. Taking a conservative approach, the trader is waiting for a breakout and retesting of the line from the reverse side. With an aggressive strategy, an entry is made even before a breakout takes place.
However, with an aggressive approach, the use of protective orders is a must-do. In case the price changes its trajectory, the losses will be minimal.
You may also like:
Standard deviation trading strategy


