


All speculators strive to buy any asset at its lows and sell it at its highs. In this frenzy, traders sometimes neglect common sense. Therefore, it is essential to understand in which direction the market is actually moving and whether the price could reverse in practice or it is just a trap. Let’s discuss traps in trading in this article.
This article explains what is trading using bear trap trading.
You can learn more about other specifics related to trading in the stock and other markets in the article "What is trading about".
What is bear trap trading?
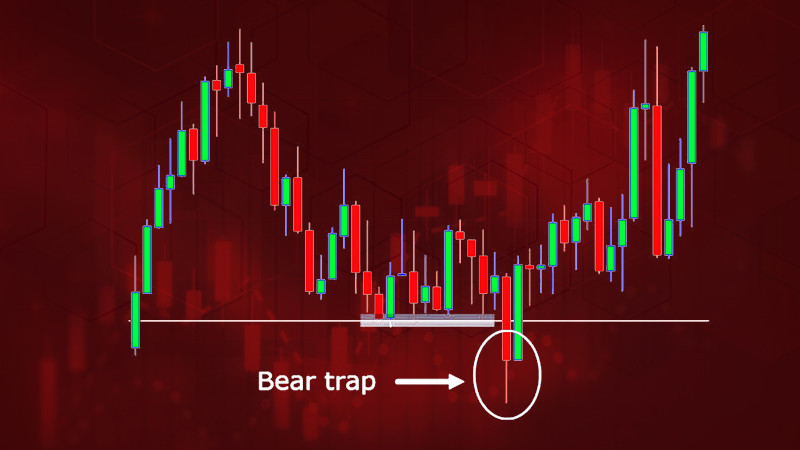
So, let's take a closer look at what a bear trap is, trading with this concept in mind. In short, a trap is a false breakout after which the current uptrend does not turn into a downtrend.
A bear trap, or simply a trap, "waits" for traders during an uptrend or after a period of consolidation. When there is a slight decline in the market, many inexperienced speculators take this as a signal to change the trend.
The occurrence of a trap makes a rookie trader treat this as a decrease in the asset’s value and encourages a trader to open sell positions.
However, frequently there is no change in trend. So, after a small pullback, the price goes ahead in the upward direction. A trader who has fallen into a trap loses their funds.
Oftentimes, such traps are artificially created by larger players in the market. By means of such manipulations, they can buy assets at a lower price. The bullish trend continues to dominate the market again.
Bear traps often appear on the charts of promising companies. For example, at one time, Tesla shares aroused skepticism among investors, and many did not believe that the asset would ever rise in value.
With such prospects, traders sold the company's shares during periods of a decline in their value. In reality, all short-term falls in value were just traps, after which the price continued its upward movement.
Bulls vs bears
In trading and investing, there are two basic groups of traders: these are bulls and bears. Whereas bulls trade betting on an increase in market quotes, bears rely on a decrease in exchange rates or the value of certain assets. Let us analyze in more detail the essence of each strategy.
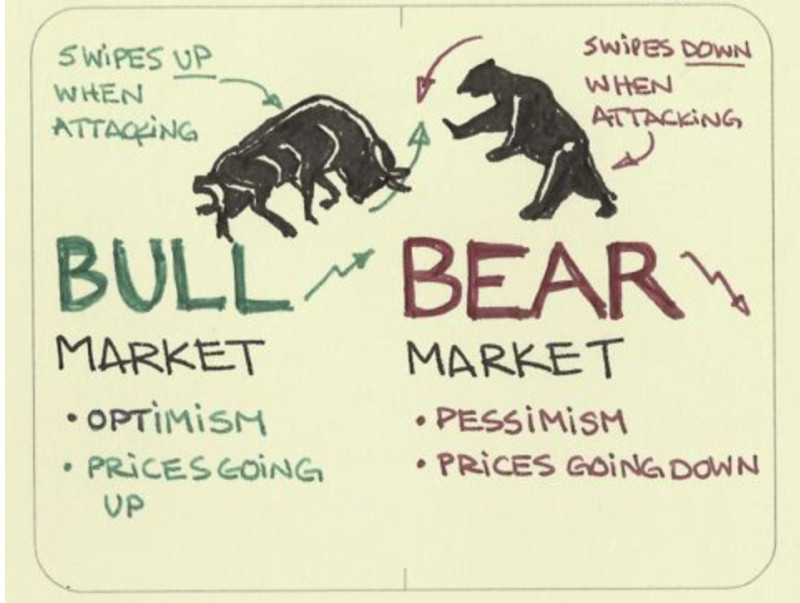
Bulls, or buyers, are betting on an increase in the asset’s price and are trying to capitalize on it. Bears, or sellers, on the contrary, seek to profit from a decrease in the asset’s value.
When buyers set the tone on the market, there are many bids to buy an asset. Accordingly, market quotes go up, and the market is called bullish. When sellers dominate, they put pressure on the price, which causes it to go down. Such a market is called a bear market.
Depending on the main trading strategies that the trader adopts, market participants can be divided into bulls and bears. The bulls open short positions when they want to get rid of an asset that becomes less profitable, that is, loses its value.
Bear traders follow a different strategy: they sell an asset in order to buy it back later at a beneficial price. That is why they most often fall into a bear trap.
Seeing the impulse to decrease in value, the trader sells the asset in the hope that its value will drop even lower, and they will be able to buy it even cheaper. However, in reality, after a slight decline, the asset’s value rebounds again. As a result, the trader loses their assets and funds.
How does bear trap trading show up?
Importantly, traps commonly pop up as a result of manipulations of large market players who own a large amount of one or another asset.
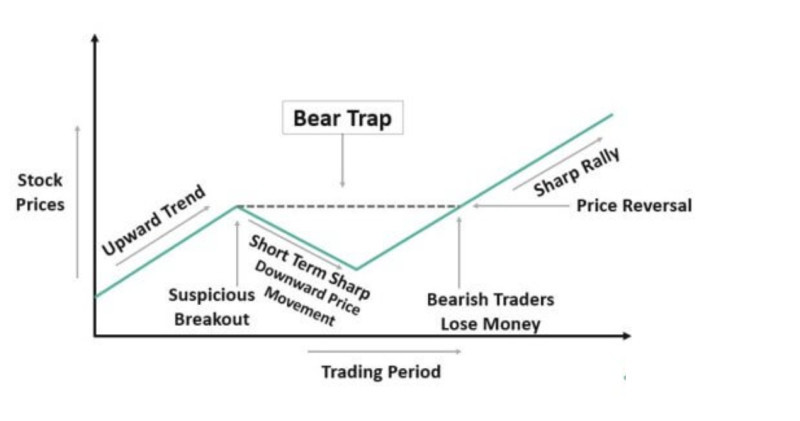
The thing is that the trend preceding the occurrence of the trap can last for a long time. Therefore, when some trend reversal signals appear, many traders perceive them as a true reversal, although in fact, they end up being false.
In the case of a bear trap, this happens as follows. There are a large number of buyers in the market who want to buy an asset, but not enough sellers.
Buyers then raise their bids, which is the price they are willing to pay for the asset. This attracts more sellers, which automatically makes the market go up.
At the same time, when assets are bought, they put pressure on the market, as investors can only make a profit after selling the assets. Therefore, when active buying occurs, the buying pressure decreases and the selling pressure increases.
To encourage demand and boost asset values, companies can lower prices to make markets look bearish. Seeing this situation, novice traders rush to sell assets.
The asset’s price goes down, large players return to the market. They begin to actively buy, as a result of which the asset’s price begins to increase again along with an increase in consumer demand.
To sum up, a bear trap is formed during the period of a temporary decrease in the value of a trading instrument. Many traders who fall into it are driven not only by the lack of experience but also by greed, i.e. the desire for a quick profit.
Why traders fall into a trap
You are probably aware of traps on charts. However, many traders still cannot avoid falling into them. There are a number of reasons why traders are caught in bear or bull traps. We will analyze the main ones in this chapter:
1. Lack of trading experience. Oftentimes, rookie traders fall into the trap as they understand each price movement as a potential reversal.
It is necessary to be able to differentiate a true breakout from a false one. To do this, you can use various methods, from which follows the next paragraph.
2. Insufficient use of tools for market analysis. If a trader uses a small number of indicators and other analytical tools, it will be more difficult to correctly assess the situation.
To make the right trading decisions, you need to grasp the whole picture. Therefore, a sharp jump in value or a sharp drop should be confirmed using reversal candlestick patterns or technical indicators.
3. Emotional component. Those traders who are affected by emotions and stress are more likely to get into traps than calm and balanced traders.
Every trader should have a strategy with clear rules for entering and exiting trades. If the user follows his trading algorithm, there will be fewer rash decisions.
4. Psychological component. It happens that the trader simply convinces himself that a reversal is planned in the market. Therefore, he "adjusts" all the signals that appear on the chart to his own interpretation of what is happening, neglecting the real situation.
Watch out traps!
Now let's talk about how to do it in such a way as to minimize the damage from such a situation as a bear trap. A trading strategy should take into account the possibility of such a situation and ways to identify it.
There are several basic methods for spotting a trap in the market and not falling into it. We list the main ones:
- Traders are strongly recommended to keep track of the latest news in the field of economics and finance. For example, in the case of shares, it is essential to check information about the issuing company.
If the news does not contain any serious negative points that could negatively affect the asset’s value, this most likely indicates that a bear trap is about to emerge.
The same is true for any other assets. To analyze currencies, traders should monitor the latest macroeconomic indicators, the most significant economic and political news.
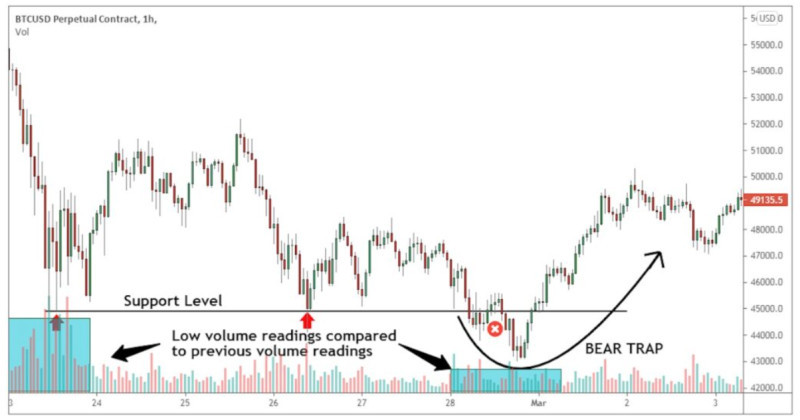
2. Conducting volume analysis. It is necessary to pay attention to how trading volumes change while the market situation changes. At the moment when a false breakout or a bear trap occurs, trading volumes are at a lower level than during an overall trend.
3. Checking the conditions for the trend development. There are some rules by which a trend is formed in the market. Using these rules, you can understand whether a change in trend is really happening or whether the previous one is going on.
So, with a bullish trend, each subsequent high is located above the previous one. During a bearish trend, on the contrary, each subsequent low and high is located below the previous one.
How to evade traps
In addition to those mentioned in the previous chapter, there are several other methods to avoid falling into traps. Let's look at them in more detail in this section.
- Finding divergences/convergences is the most well-known way to spot a bear trap. In this case, we are interested in the bullish divergence. The divergence in the movement of the asset’s price and the indicator chart is considered a powerful signal, especially when it forms on larger timeframes.
As a rule, oscillators, such as MACD, are used to identify divergence on the chart. This indicator consists of a histogram and two moving averages.
When a price breakout and a rapid change in the value of an asset occurs on the price chart, and a divergence or convergence forms on the MACD chart, this indicates that a trap has shown up.
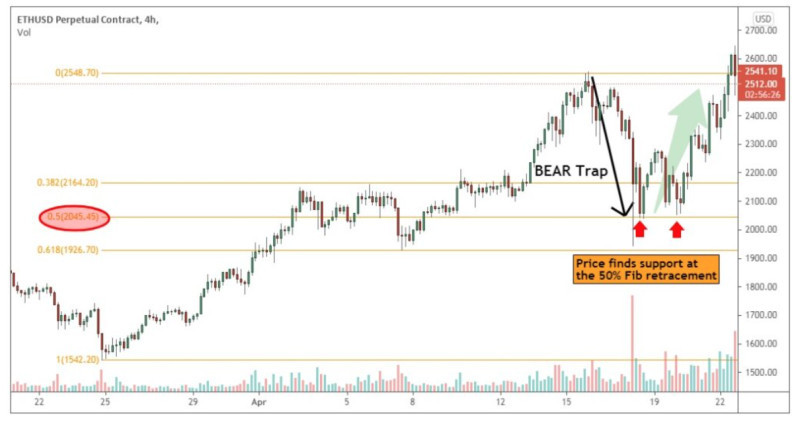
•Fibonacci levels. They are plotted on a chart in the form of a grid with certain values. These lines define strong support and resistance levels, when passing through which the price can make a true reversal.
In addition, these levels can serve as guidelines for placing stop loss orders. However, this method is suitable for experienced traders. It will be more difficult for beginners to use it.
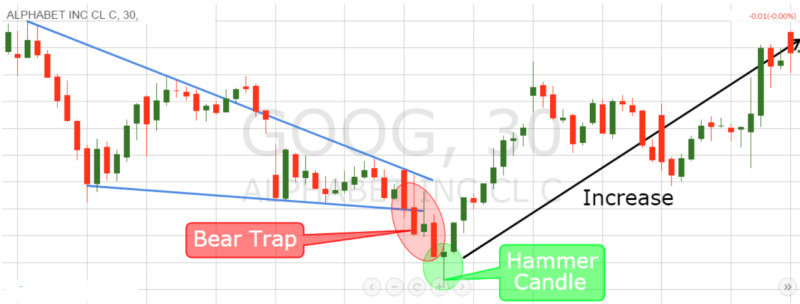
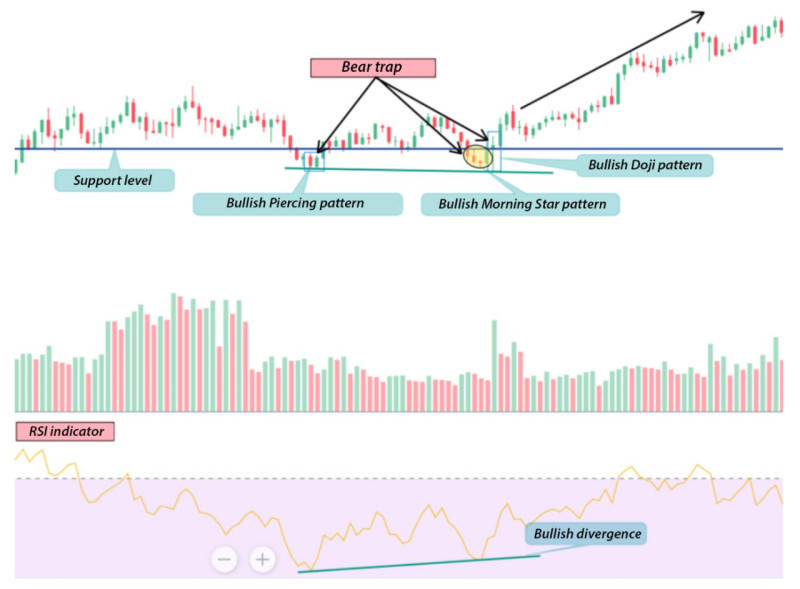
• Candlestick analysis. In order to anticipate the formation of a trap in advance, you can look for candlestick patterns on charts. In the case of bear traps, you need to look for bullish patterns.
Candles themselves can form various patterns, which sometimes include only one candle of a certain type. Such combinations may indicate the continuation of the overall trend or its reversal.
In the case of a bear trap, you need to pay attention to candlestick patterns that indicate a further increase in value. These patterns include Hammer, Engulfing, Morning Star, and others.
What is bull trap in trading?
The bull trap is the exact opposite of the bear trap. Bull traders must allow for the possibility of this phenomenon in trading strategies and know how to work with it.
A bull trap can occur when a bearish trend rules the market. After a long decline in the value of an asset, many traders are waiting for the price to turn upward.
This mainly happens because of the desire to buy an asset at a bargain price, and then wait for the price to rise and sell the asset profitably.
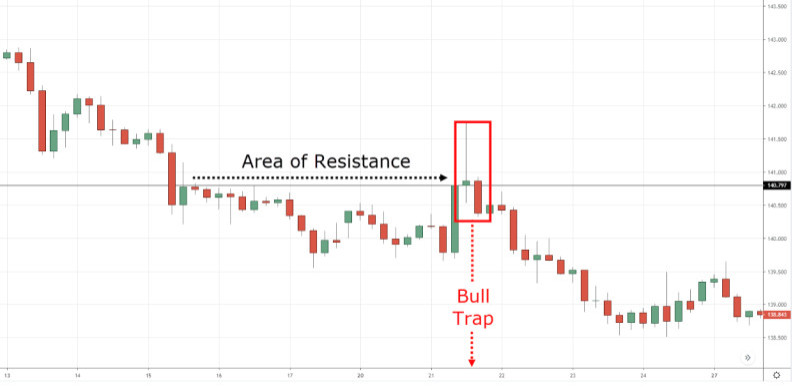
As soon as a bull trap appears on the chart, the price makes an attempt to make a reversal in the upward direction, so many inexperienced traders begin to open buy positions.
However, such a sudden increase in value is oftentimes very short-lived. After that, the price continues to decline and often falls even lower than the previous levels.
Traders who have fallen into a bull trap have only two options for further developments. They can either sell the asset at an unfavorable price, or hold it in the hope that the value will turn around and they will be able to win back their loss.
This situation occurs with the shares of pharmaceutical companies during the development and introduction of new drugs to the market. This takes quite a long time since the drug goes through a lot of stages.
Further, everything depends on the final result: if the company manages to create a new unique product for which there is demand, then the value of the company's shares begins to grow along with the popularity of the new drug.
How to avoid falling into a bull trap
Bull traps often appear due to the manipulation of large players in the market. With the help of such traps, they create favorable conditions for sellers.
When other traders believe that the asset’s value is starting to rise, the bears have an opportunity to sell the asset at a higher price and make more profit.
Sometimes, bull traps are formed due to the natural movement of the price, for example, as a short-term market response to any news or events.
Regardless of the reason for the bull trap in the market, there are several methods to reduce the risk of getting into it.
1. We have already said more than once that a trap is formed in the form of a breakout. In this case, it is a breakout of the resistance level. Therefore, to confirm the reversal, it is necessary to wait until this level is retested in the chart.
If the price retests the level and settles above it, this may indicate a genuine breakout. So, there is no bull trap.
2. Breakout confirmation using trading volumes. Volume indicators are already built into modern trading platforms, so they can be easily applied to any chart.
A strong upward movement in the asset’s value accompanied by a sharp increase in trading volumes most likely confirms a reversal. If, along with a sharp jump in price, there is no increase in trading volumes, this may indicate the formation of a trap.
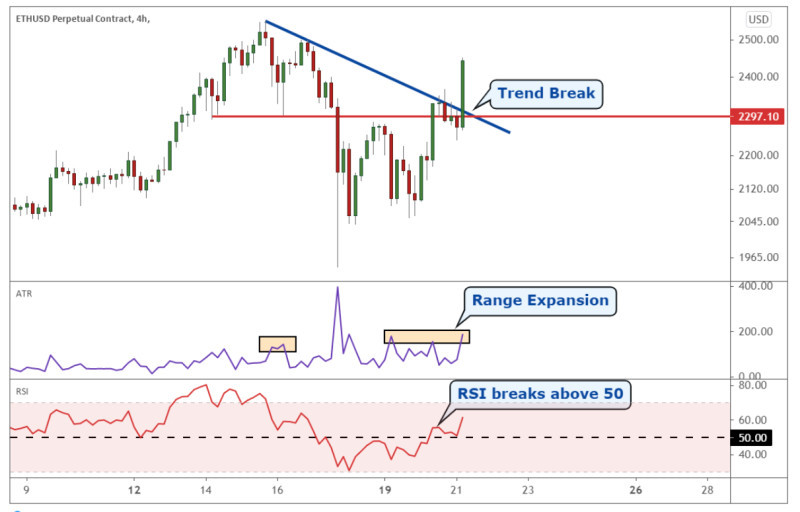
3. As in the case of a bear trap, an oscillator, such as MACD, RSI or Stochastic, can be used as additional analytical tools.
These tools help to identify oversold or overbought areas of assets, as well as divergence and convergence on the chart.
Bear trap trading
Is it possible to trade during periods when traps poop up in the market? How to use them for your own benefit and take them into account in your trading strategies? Let's look at the options for trading algorithms in this section.
One strategy is to trade out of the trap. This algorithm provides for opening a position after the formation of a bear trap. The RSI indicator is used as an extra tool.
To confirm the formation of a trap, a trader should check the formation of a bullish divergence on the oscillator chart. Also, an important rule is to use a larger timeframe, for example, H4.
Next, you need to analyze the candlestick patterns that confirm the bullish trend. After the price exits the trap and settles above the support level, you can open a position.
Another version of the trading strategy is riskier than the previous one and involves trading inside the trap itself. This method can only be implemented with a few confirmations.
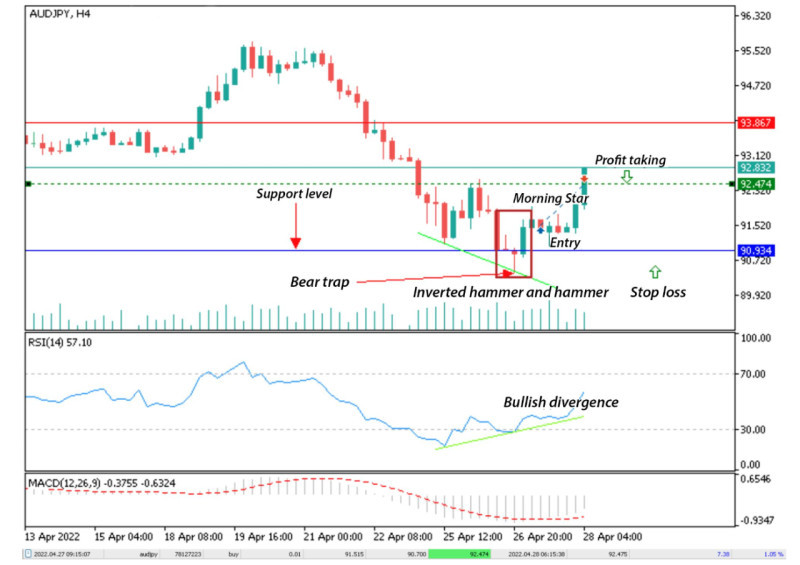
This strategy uses the readings of the MACD indicator, which should indicate the presence of divergence. In addition, confirming signals prove the appearance of bullish reversal candle combinations, such as the Inverted Hammer.
When there are such confirmations, then a long position can be opened already inside the bear trap. Thus, the trader can make a profit even during a small period of growth in value.
Setting stop-loss orders also has its own rules. A stop loss is set just below the entry point, that is, the formation of a bear trap. Profit-taking should be carried out during the appearance of bearish patterns, for example, a Shooting Star.
Rules for traders
In order for a trader not to lose their savings while a bear trap is forming on the chart, trading must be carried out taking into account some rules. We have collected the main ones in this section.
1. Gain knowledge and experience, train on demo accounts. Inexperienced traders are prone to fall into traps and perceive almost every price movement as a potential reversal.
2. Don't be influenced by emotions. All trading decisions should be made with a cool head. Feelings are never good trading advisers. Your decisions must be thoughtful and balanced.
3. Develop your trading strategy and strictly adhere to its rules. This is a common recommendation, but not all traders apply this rule in practice. The trading algorithm should include instructions for entering and exiting trades in various situations.
4. As we have already said, a bear trap trading is a false breakout that gives the trader hope for a change from an uptrend to a downtrend. To confirm or deny the truth of the breakout, you can use a lot of tools: from technical indicators to candlestick patterns.
5. Apply several tools at a time to analyze the current market situation. For these purposes, volume indicators, oscillators, as well as candlestick patterns, which are formed by the chart itself, are well suited.
6. In parallel with technical analysis, don’t forget to study the news background. Hence, don’t neglect fundamental analysis. It is necessary to control the release of financial reports of companies, the publication of macroeconomic data, and other economic and political news.
7. Make sure you place protective orders so as not to lose funds in case a breakdown still turns out to be false. In such a situation, even if you fall into a trap, your losses will be minimal.
8. Choose larger time frames in order to see the full picture of what is happening in the market. Even if you use shorter time frames, check the correctness of your methods using higher time frames.
Conclusion
In this article, we examined the basic concepts and specifics of bear and bull traps on the charts. They can appear on the charts of absolutely any asset and are often artificially created by large players.
Inexperienced traders who do not have enough knowledge and skills to correctly assess the current market situation commonly fall into such traps. The trap is formed as a false breakout in one direction or the other.
In the case of a bear trap, the breakout occurs on an uptrend or after the end of a consolidation period in the downward direction.
However, such a fall is short-lived, and the price continues to move up.
In the case of a bull trap, on the contrary, there is a downward trend in the market, which is interrupted by a short-term price jump. After a short period of growth, the price continues to decline.
During periods of traps, rookie traders open positions against the current trend. As a result, they lose their funds. There are several ways to avoid getting into the traps that have been described above.
You may also like:


