


The Volume Spread Analysis method (VSA) was developed at the beginning of the 20th century. It was then that young Wall Street courier Richard Wyckoff decided to try his hand at trading.
Inborn curiosity and analytical mindset soon enabled him to find out what trading is and make some significant discoveries. They concerned price movements and their dependence on large volumes, that is, traders with large capital.
The initial conclusions that Mr. Wyckoff arrived at were related to the accumulation of volumes and their redistribution during trading. Major players were the ones who controlled the market. The main trend was determined based on their positions. Therefore, it was important to find these players and analyze their work.
Thus, a strategy emerged that was later named the Wyckoff method. During his lifetime, the renowned expert of the international market taught this method to a large number of investors. It became very popular and has proved to be quite effecient.
Thanks to its wide popularity, the Wyckoff method became well known to another outstanding trader, Tom Williams. It happened in the mid-twentieth century.
Tom started with intraday trading. It was the most popular method at that time. Soon, he noticed some peciliarities of the Wyckoff strategy and upgraded it by adding the spread analysis. From that moment, the method was called Volume Spread Analysis (VSA).
Further on, Alexander Elder and David Weiss also contributed to the improvement of this method, so nowadays traders use the upgraded VSA.
VSA: volume trading
VSA stands for Volume Spread Analysis. It is a specific trading method based on the analysis of trading volumes and spreads.
A trading volume is a total amount of money traded within a certain period of time, i.e. a timeframe.
A spread is a difference between the highest and lowest values of a bar (a candlestick). In other words, it is a length of a bar (a candlestick).
| Volume Spread Analysis is the type of analysis of candlestick charts based on spead and volume. |
The key principle is that volume has a great impact on the market sentiment. Major players always try to hide their presence by disguising themselves as carefully as possible.
They have a lot of tricks on how to make their appearance on the market invisible. Of course, a large volume, that is, large transactions can be seen immediately, so various tricks are used. For example, big traders often split their funds by placing several trades.
Such tricks allow large investors to work unnoticed, but experienced traders can recognize them with the help of proper analysis. Most often, the trail of big players is noticeable when comparing the volume with the spread. This is the basis of the classical VSA method.
The VSA method cannot be considered a trading strategy, as it does not provide any definite signals on when to close or open a trade. This function pertains to the technical analysis method.
When analyzing volumes, an investor gets a general picture of what is happening on the market. Specifically, they can see when a big player enters the market. It is important to notice this in order to maitain the direction in case of false price fluctuations.
Applying VSA in Different Markets
Wyckoff's theory is universal, so it can be used in any international market. However, there are certain important peculiarities to keep in mind.
The main peculiarity lies in the level of liquidity. Nevertheless, the general principles of the method remain unchanged in this context, merely adapting to the given conditions.
The Forex market possesses several distinct features that need to be taken into account when employing volume analysis. Firstly, there is the matter of its decentralized structure.
It's impossible to assess separately all volume indicators of contracts. A practical solution is to use the tick volume.
In this case, the broker that a trader cooperates with will show the number of open positions within a particular timeframe. Of course, this volume will be much smaller than the total market volume, but even this data will be enough to make a good use of the VSA method.
It's important for traders to factor in the price movement dynamics, also known as the background, as it's this that determines the main market trends at any given moment.
Tick volumes track this well. The main thing is not to overlook the most preferable time intervals.
For analyzing historical background, intervals typically ranging from 15 to 20 candles (bars) over a specific timeframe are usually suitable. In addition, daily and weekly charts tend to provide more accurate information.
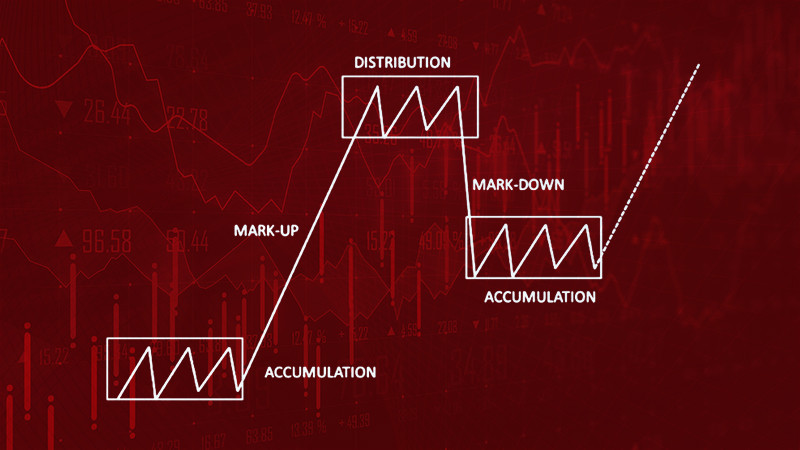
Overall, the market activity of a candlestick chart is usually divided into several periods.
Three phases of price movements on a currency market
| # | Phase | Description |
| 1. | Accumulation | This phase starts that the previous trend ends, i.e. reverses. Most market participants anticipate the coming reversal, so they start closing their positions. Large investors take the lead and start buying actively. They aim to open as many buy deals as possible at a benefitial price. This way, they keep the current trend for some time. In such conditions, a price enters a sideways trend, meaning it consolidates and barely moves. |
| 2. | Trend (upward/downward) | Subsequently, the market reaches a pivotal point when the amount of amassed capital becomes too big. Positions of a large volume also add weight to this situation. Importantly, the accumulation can turn the trend direction either to the upside or the downside, thus resulting in a bullish or a bearish trend respectively. |
| 3. | Distribution | This phase looks similar to the Accumulation, on the surface. The key difference is that it forms a reverse trend, essentially an opposite direction. It's also called a period of flat or sideways trading. This is when big market players start actively closing their positions by selling off their assets to smaller traders. |
To master the VSA method, it is essential to distinguish between these three main phases and transitional periods. It is also important to find out what useful information this type of analysis can generate.
Principles of using volume analysis:
• Determining the current supply and demand ratio.
It's crucial to understand the market volume that belongs to major market players at a given time frame. They're the ones who have the most significant impact on market dynamics.
When demand begins to rise, the first orders to be filled are the buy orders within the lower price range. This tendency pushes up the asset's price.
The same process takes place in reverse. When a bearish trend shapes the market, there is an rise in new sell contracts. As a result, the price decreases.
Important! The total volume of trades may stay the same, and sometimes even grow. That's why it's essential to carefully examine the structure of a candlestick (a bar).
• Uncovering cause and effect relationships
Every market movement does not arise from nothing, it's shaped by certain influencing factors. Some of these factors might be inconsequential, incapable of causing significant changes, while others can lead to substantial shifts in the market.
The entry of large market players with their massive volumes sets the market in motion instantly. The impulse strengh is also directly dependent on the volume.
When trading volumes are low, the duration of market fluctuations tends to be shorter. This is typically observed during market pullbacks or minor corrective phases.
Important! A thorough assessment of the overall market backgorund is essential for accurate analysis. Otherwise, you may make mistakes. Sometimes, the momentum carried over from previous volumes can be mistakenly identified as a new market movement.
• Determining the dependance of results on effor
The emergence of a significant correlation between supply and demand can often signal the formation of a new trend. However, this isn't always the case.
The Volume Spread Analysis (VSA) is a great tool for highlighting such instances. When it becomes evident that it no longer aligns with the logic of other tools, the likelihood of speculative manipulation greatly increases.
Important! Volume analysis should always be cross-verified with other indicators as alone it cannot provide a comprehensive and reliable picture of the market situation.
It's essential to understand that VSA analysis isn't a simple methodology. It's not particularly suited for those making their first steps in financial markets.
Before embarking on it, one should delve deeper into the overall mechanics and structure of the market. It is essential to be able to effectively navigate through all the price formation models, as well as understanding the nuances of supply and demand.
The primary challenge of the methodology is that the analysis is constructed parallel to manipulative theories. This means that the tricks employed by big players carry a significant, if not the most significant, weight. But nowadays, price manipulations in markets are often not taken seriously.
Key signals of Volume Spread Analysis
The classical VSA method produces several dozens of signals that help traders to assess the current market situation. Tom Williams who extended the initial VSA version described over one hundred of patterns.
However, not all of these patterns are widely used. Below you will find the description of the most popular one that have proven their efficiency through the practice of many traders.
Up-Thrust
The Up-thrust, a.k.a. the upward breakout is one of the most popular signals in this method. It can be detected across various timeframes and appears quite frequently. It is fairly simple to use, which adds to its convenience.
In classical understanding, the Up-thrust is a bearish signal or a trap for big players. It allows for the triggering of stop orders and attracts a large number of smaller participants to trade. While the subsequent price movement doesn't change, the market amasses substantial volumes of so-called "smart money".
Important! This signal performs poorly in highly liquid markets where price manipulations are rare.
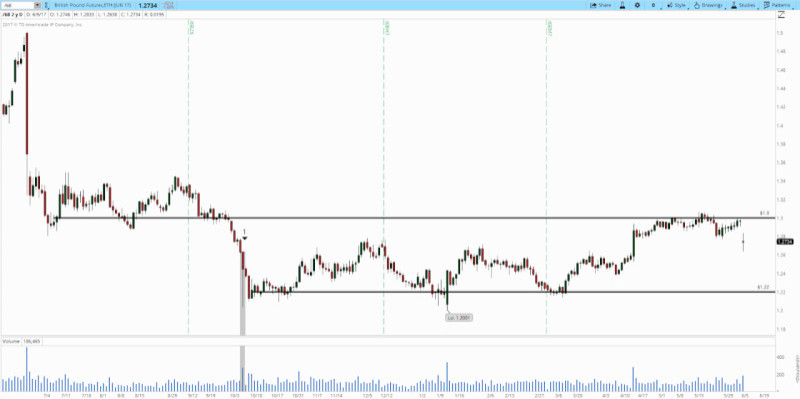
The pattern usually emerges at the upper boundary of the consolidation level. It can occasionally be found during corrections and re-testing of support levels which subsequently switch to resistance.
It has a direct and strong dependency on news.
Signals can also show the presence of big market participants. A clear indication of that is aggressive and volatile price movements. However, these participants cannot control how far the price may go.
They are only capable of setting the market into motion, thus affecting traders' emotions.
Therefore, it is advisable to use additional tools of market analysis. Patience and cool head should prevail over emotions.
Shakeout
This is another signal that traders recognize as effective. The Shakeout appears during bullish trends. It is commonly found across different timeframes.
In simple terms, it represents a mirror image of the Up-thrust described above.
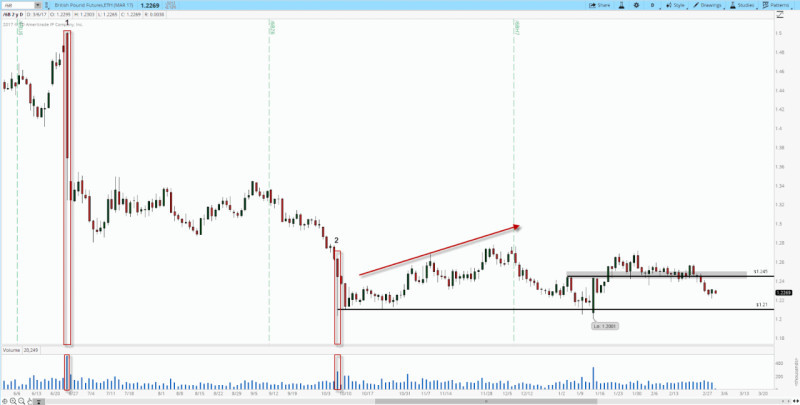
Its occurrence is often related to corrections during upward movements, and also with consolidation zones, which are located at the lower boundaries of the channel.
The signal represents the most dangerous move made by big players, as it triggers stop losses and traps small participants near the support level.
The Shakeout becomes more distinct during consolidation periods, when the number of limit orders is excessively high.
Traders are advised to use this signal in conjunction with other tools of technical analysis. It is also important to determine the support level correctly.
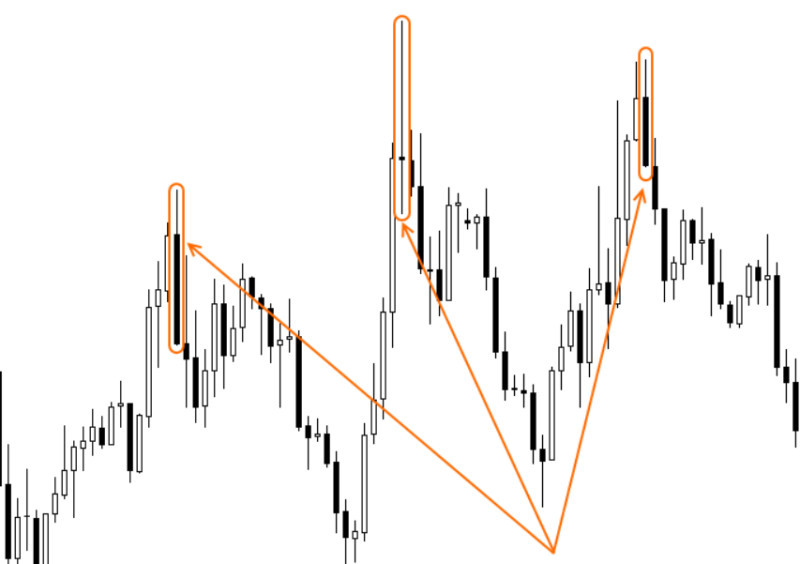
Buying and Selling Climax pattern
This pattern is quite important and is recommended for all traders working with the VSA method. It is considered one of the most significant and powerful signals in classical analysis. Both professional and retail traders actively use it.
To understand how the signal works, it is necessary to understand what is happening in the market at that moment. Suppose large investors have managed to profit from some trade, but now the task is to close it with profit.
To sell assets, one should find a buyer, and it can take some time. Waiting for buyers is not profitable, and selling everything at once is not possible, so professionals resort to manipulations.
They artificially stimulate interest in buying, knowing that retail traders are aiming to enter the market at the very end. The price starts to rise, acting as the last call for speculators.
At this point, big investors start selling their assets, not all at once, but in parts. This is the only way they can remain unnoticed.
So, the benefit is clear: the extra liquidity pushes the price higher, making small investors make erroneous purchases at the end of an uptrend.
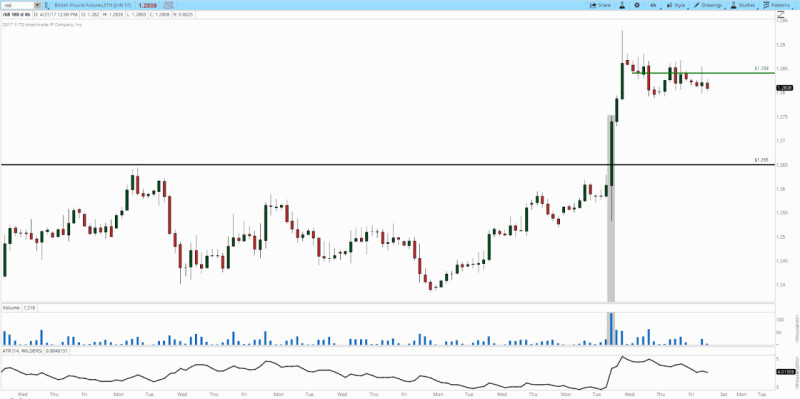
It is possible to determine this signal by increased volatility in relation to the total volume.
The Climax signal is easily recognized. Its key feature is volatility. The signal appears as a result of prolonged movement that entails large volume and spread regardless of whether a candle closes to the upside or downside.
During such periods, trading is not recommended.
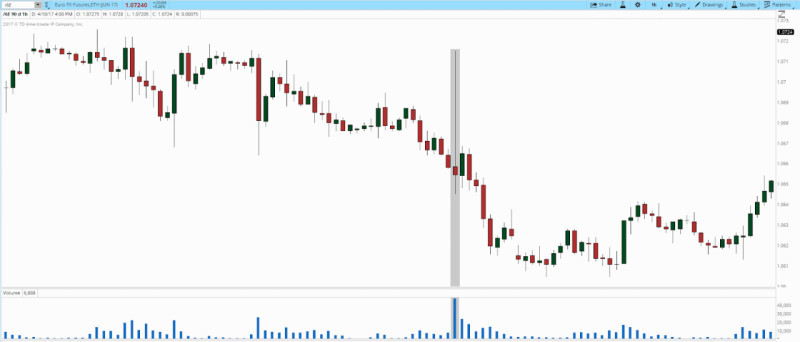
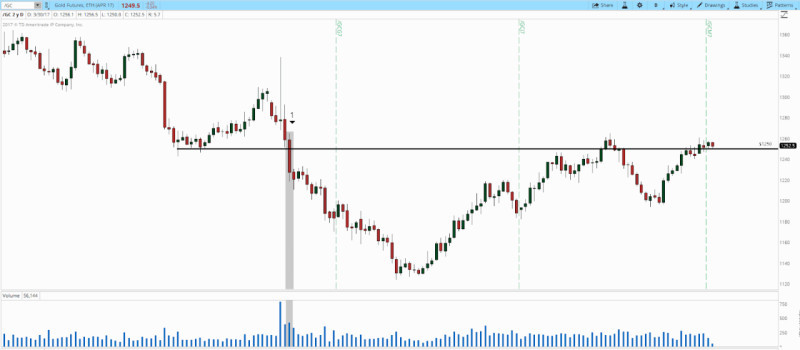
The Stopping Volume signal
The Stopping Volume pattern usually occurs at the end of a trend or during consolidation. It serves to indicate that the current movement is likely to cease.
Important! The Stopping Volume does not always signal trend reversal, it just indicates the end of a current trend.
The pattern can appear on any timeframe. It is closely connected with the need to find a seller. If there are no sellers, a market maker takes on this role. It triggers a massive response when retail traders rush to enter the market to scoop their portion of profits.
Big players, in turn, aim to profit from heightened liquidity, so they start moving inversely, i.e. selling assets in small portions.
At such moments, it is worth paying attention to a trade volume, as it is likely to increase significantly. Volatility may rise as well. Then, the price movement comes to a halt, so the next step is either consolidation or reversal.
This signal plays an important role in determining the general balance on the market which is hardly distinguishable outside a broad context.
An inexperienced trader may misinterpret its signal and incur big losses. In such a case, the best solution is to close a position regardless of profits.
Another smart decision would be to take a wait-and-see approach. Experts recommend against opening a counter-trend trade right after the signal appearance. In most cases, the accumulation or distribution phase start following it.
The Capitulation signal
This commonly encountered signal is associated with volatility spikes in either direction, as well as with price gaps.
Political news or macroeconomic events, which can significantly alter market dynamics, may trigger this signal. For this reason, it is advisable to refrain from active trading ahead of major economic news releases, as the risk level becomes excessively high.
Capitulation is characterized by a distinct imbalance of demand or supply. This becomes the catalyst for the price movements. The signal redirects the price towards the spreads with the highest intensity.
Forecasting based on this signal can be quite challenging, as it often appears unexpectedly and influences traders' emotions. For this reason, one should not rush to open a position immediately after the first impulse emerges.
It's best to wait until the price reaches a resistance level while volatility decreases. Only then a profit can be obtained with a higher degree of probability.
The Demand and Supply Test signal
This signal is designed to allow a major investor to detect the presence of a bullish or bearish trend. Additionally, it reflects the desire to enter into buying or selling within a given price range.
Testing can be identified across any time frames and markets, as well as with various trading styles. It serves as a very convenient signal for determining traders' sentiments in the short to medium term.
It has two aspects - demand and supply - which significantly simplifies the analysis. The absence of these indicators suggests that major players have not entered the market.
Basically, the pattern serves to demonstrate the appearance of large players and reflect the market sentiment. It is not used to raise profits.
This signal is quite hard to recognize, as it looks quite similar to other signals.
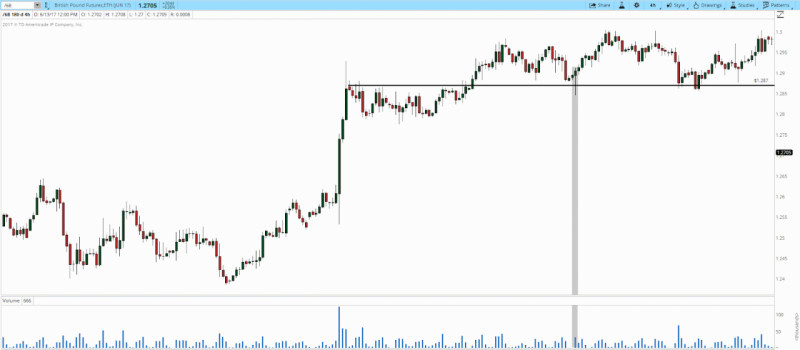
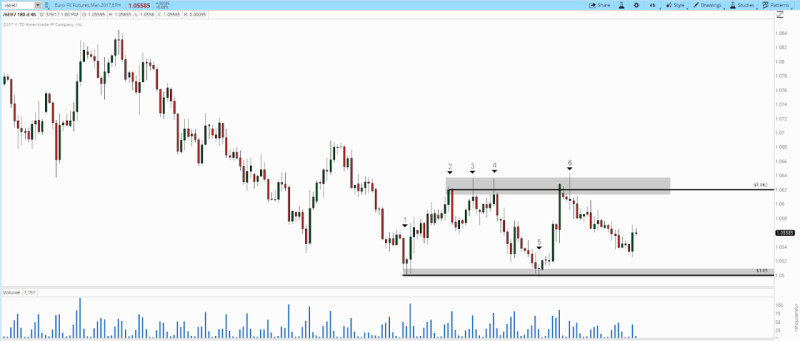
Level Attack signal
This signal is easy to grasp, increasing its usage frequency. All it takes is identifying support and resistance levels, then analyzing the price behavior relative to the volume that builds up around it.
You look for situations where, as a certain resistance or support level is breached, the bulls and bears might shift their stance based on their interests and market conditions.
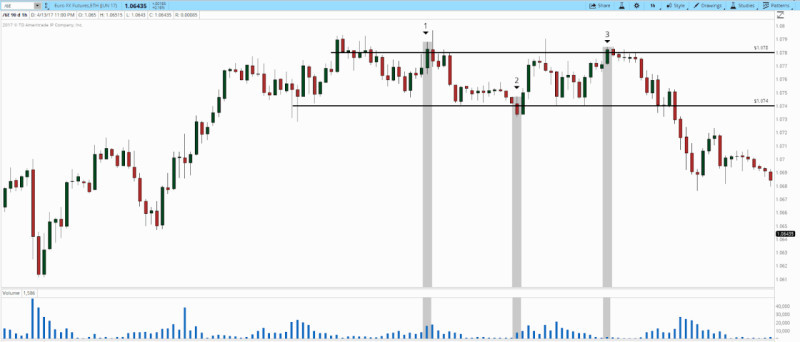
The chart depicts the absorption of limit orders to buy or sell.
Sellers and buyers place limit orders hoping that the price will bounce or break through a predetermined range. In this backdrop, a struggle between them unfolds.
Often, a price bounce occurs, but either supply or demand stays dominant. Then, the bull volume increases as they actively buy up the pending limits. Alternatively, sellers might shift their orders to a higher level.
Bears might hit a stop on their open orders, opening up opportunities for the buyers. The price then breaks out of the consolidation level.
This signal is handy for getting a read on the overall market mood. Traders should brace for potential swift bull or bear movements following level attacks and subsequent exits from the defined range.
This pattern is particularly useful in the short to medium-term price movement perspective.
No Demand and No Supply signal
In trading, there is the constant struggle between buying and selling in the market. Traders, based on their knowledge, intuition, and market analysis, decide whether to side with the bulls or bears.
The imbalance that happens between these key categories exerts serious pressure on the price, causing it to sway one way or the other. When there are more buyers, the price nudges upwards, and vice versa.
Theoretically, situations might arise when the total number of sellers and buyers match. In such a case, the price would freeze at a certain point and stop moving.
However, in reality, absolute balance is next to impossible, though relative balance, often termed as a 'range' or 'sideways trend', can occur. Dominance here is determined not by the number of investors, but by the volume of buy or sell trades.
The pattern is based on the idea that without major players, price movement comes to a halt, while volatility and impulsivity decrease. However, this is not always the case, so it's crucial to keep a keen eye on how demand and supply shifts when crossing significant levels.
The signal helps traders determine the price direction following the period when there is relatively neither supply nor demand in the market. However, the pattern is only 50% efficient, so it fails to identify certain important tendencies.
The market situation constantly changes, with different market setups changing one another. A trader's task is to analyze and determine which method is most suitable under certain conditions. The signals of VSA analysis serve to solve this task.
VSA indicator: a must-have tool for any trader
Today, a vast array of different indicators has been developed for trading in international markets, including those for volume analysis.
Typically, volume-determining programs are designed to pinpoint moments when a major player emerges in the market, in other words, when their volume increases.
For retail investors, this serves as a cue that it's time to kick their trading into high gear to make a profit.
Volume indicators come in a myriad of forms and types. They can calculate virtually all popular candlestick combinations and pinpoint the most opportune moment to enter the market with great precision.
The most popular and widely used indicators are presented below.
Top 3 Best Indicators for VSA Analysis
| # | Indicator | Description | Signals |
| 1. | WSD Histogram | Designed as a tool for detecting discrepancies between volume and price indicators. Its task is to analyze tick volume data. Additionally, it reflects support and resistance levels based on the current value of demand and supply. The main setting parameter is the moving average period. | Green rhombus – buy Red rhombus – sell Gray rhombus – refrain from trading |
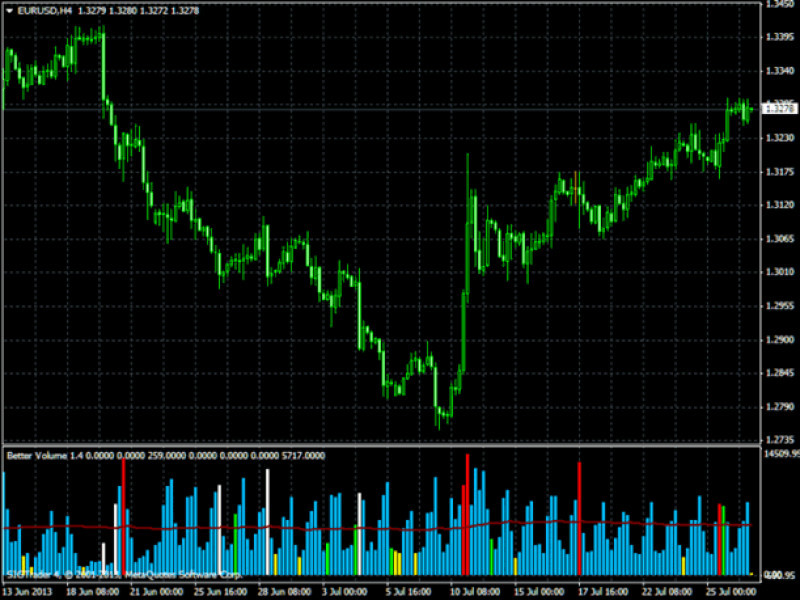
| 2. | Better Volume | The calculation of this indicator is based on the strongest candlestick patterns. Volumes are displayed in a form of columns that differ by height and color. Visual filtering is ensured by moving average. | Blue color – no significant volumes Red color – bullish candlestick with high spread and volume White color – bearish candlestick with high spread and volume Green color – candlestick with low spread and high volume Purple color – a candlestick with high volume and any spread level Yellow color – a candlestick with low volume |
| 3. | Sonic R | This indicator is used to track volume and spread algorithms by marking the presence of large players. It determines the moment of a sharp increase in volume at which traders enter the market upon the formation of a new trend | Gray color – flat trend, low volumes (not recommended for trading) Blue color – volume rises while spread is low meaning that strength of sellers and buyers is almost equal Red color – high volume and spread which means the presence of a large seller in the market Green color – both volume and spread are high which indicates a large buyer |
The volume analysis indicators are widely used by traders, but they do not provide entirely reliable readings. It is best to use them in combination with other tools that provide a clearer picture of the market conditions.
Conclusion
The Volume Spread Analysis method is far from being simple. It has its peculiarities.
This method is suitable for experienced traders only who are well aware of how the market works. It is important to know the principles of trend formation.
At the same time, this method is quite popular thanks to its versatility. However, it should not be considered as a ready-to-use trading strategy.
It is best to use the volume analysis as an additional filter. In such a case, it may serve to determine the underlying trend.
You may also like:
Standard deviation trading strategy


