


The term "deviation" is well-known in sociology. They often have to deal with so-called deviant behavior, which is characterized by deviating from socially accepted rules and norms. Rules and standards apply to mankind primarily through laws, customs, and age-old ordinances.
Financial markets also have their norms. These norms are shaped by economic factors. Deviating from these rules is what is known as "deviance" in the foreign exchange market. Every experienced trader knows what is trading with deviations. After all, the so-called "deviant", i.e. non-standard behavior of financial instruments is something that traders have to deal with very often. This article discusses the strategy of how to deal with such atypical behavior.
Understanding deviations
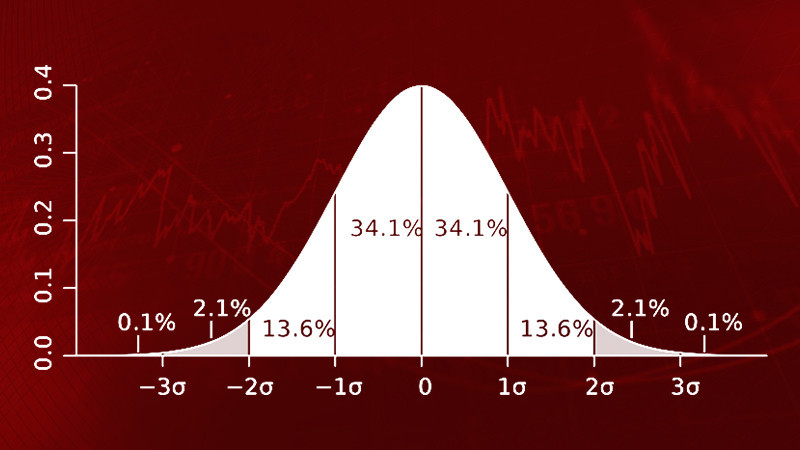
The concept of standard deviation trading strategy first appeared in mathematics. More specifically, it began to be used in mathematical analysis and descriptive statistics. There, the value of the average deviation from standard norms in a given time interval was well demonstrated. The Greek letter sigma - σ - was used to denote the deviation.
Deviation came to financial markets against the background of unusual behavior of trading instruments associated with high volatility and trend reversals.
How to change the level of volatility and understand that it has deviated from the standard? How to determine the strength of the trend? Where to place a stop-loss order? What is the SMA? The Standard Deviation indicator - the main tool for working with the Standard Deviation strategy - helps to answer these and many other questions.
Standard Deviation (STDev) is a technical analysis trading indicator. It is based on the estimation of the degree of volatility, i.e. the variability of the market for a certain period. In other words, it analyzes the deviation of the price from its statistical averages. The indicator is designed to show the degree of this deviation from a simple moving average or SMA.
The simple moving average is also a technical analysis indicator that is used to calculate the arithmetic average of the prices collected over the required interval. This tool is rather primitive because it does not allow estimating the volatility within the given range. Therefore, if the value varies from positive to negative or remains approximately the same, the SMA will give the same number.
Thus, the standard deviation is characterized by the following: the closer the price indicators are to the level of the moving average, the less significant the volatility. This means that the standard deviation is lower. In this case, we talk about the stability of quotes. The opposite situation is characterized by a greater distance from the moving average, which means higher volatility and a correspondingly higher value of SD.
The STDev tool is included in the standard package of the MetaTrader 4 trading platform. The indicator is usually considered a trend indicator, as it is closely related to the end of one market trend and the beginning of another. The higher the value of volatility, the more forcefully the trend enters the market.
What is volatility
The term "volatility" is commonly used to refer to a specified range within which price changes occur. Traders use this indicator when they need to calculate the necessary values.
How to use volatility in market
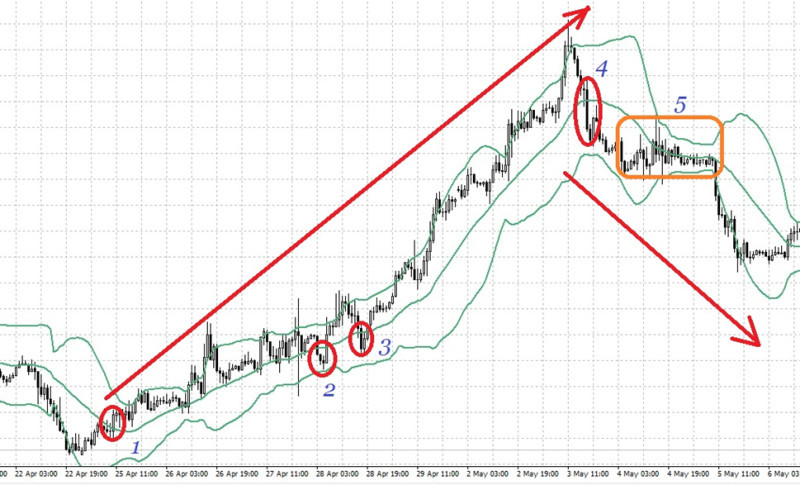
1. Determine a trend. Volatility is an indicator of trading. In its absence, trading also stops. Its increase is connected with the beginning of serious price movements. Thus, it is possible to open transactions only if volatility starts to break away from its average value.
2. The end of a trend and a reversal. The situation when the volatility value reaches its maximum level says about the coming end of the trend. These extreme values are compared with each other to determine the strength of the trend in the future.
3. Setting stop-loss orders. The main question for traders is what distance from the open trade to set a stop loss if the market trend reflects the volatility in both directions. It is recommended to estimate the average volatility with extended timeframes. This method is also suitable for setting a take profit.
How to determine volatility:
• For the daily time frame, the distance between a high and a low.
• Relative to the moving average, it is measured visually; more volatility is determined when there is a strong detachment from the selected indicator.
• Analysis of the current price with the closing price of the previous time frame. It is expressed in percentages. It has the following intervals:
- below 3% - low degree of volatility;
- 10% and more - high volatility.
Main features of Standard Deviation
1. It shows high efficiency when trading high and medium-volatility assets.
2. It is used to find good moments to start a trend or to get out of a flat. Not good for scalping because of the time lag.
3. It is more suitable for trading in the forex market than in the commodity and stock markets. The reason is simple: the currency market is characterized by frequent trend changes and a significant correlation, which is suitable for finding entry points. The stock and commodity markets are more stable.
4. The best time frame to work with is 30 minutes. In a short time frame, you can encounter the so-called price noise. It is a chaotic, multidirectional, and illogical price movement. It often leads to errors.
5. The troughs are characterized by frequent horizontal movement, while the plateau at extremely high values occurs very rarely. The standard case is a wave-like oscillation after the growth point.
Pros and cons of standard deviation
| Pros | Cons |
|
|
The Standard Deviation indicator is never used as an independent trading system. Most often, market participants combine it with other tools to determine the trend line. It is necessary to confirm the displayed signals.
How to determine deviation
Price is the main link for any indicator in the market, including STDev. It shows constant change, to follow which is necessary to work in the market.
The standard deviation trading strategy based on the calculation of the average price value. Calculations in this case are reduced to the implementation of several steps.
Five steps to calculate standard deviation
- Determine the average value of the price for the selected time interval.
- Find the deviation value by subtracting the closing price from the average value.
- Square the calculated deviation.
- Add all the squared values and divide by the total number of collected indicators.
- Output the square root of the previous calculation and you will get the standard deviation.
A rather complicated scheme for determining the indicator, in reality, is reduced to an automatic calculation using the following formula:
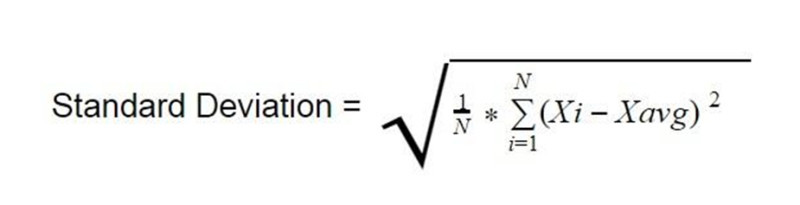
Description of the formula for calculating SD:
1) N - total number of price values for the selected period, set in the software settings
2) Xi and i - elements from the selected period. Usually, it is a fixed price at the closing of each candle for the selected period.
3) Xavg - the average value of prices for the selected period. This is the moving average described above.
The formula demonstrates that the price is a reflection of rotation around its moving average. The wider the distance between them, i.e. the farther the price from SMA, the faster the change of movement, i.e. transition to the opposite trend.
Manual calculation of the Standard deviation indicator is rarely used nowadays. The trading platform MetaTrader 4 already has such a function, so you only need to connect it and set the necessary parameters.
How to install Standard Deviation indicator
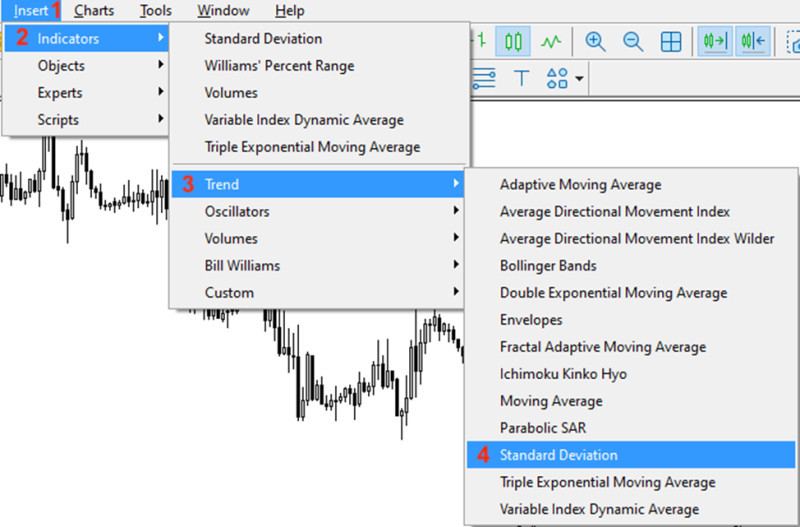
The STDev indicator is already available in the standard set of the MT4 and MT5 trading platforms. To make it work, you should activate it. To do this is very simple, it is enough to perform a few actions.
Steps to activate the SD:
1. Go the following way: Insert → Indicators → Trend lines → Standard Deviation.
2. Go to the settings of the tool, where you should select the necessary data.
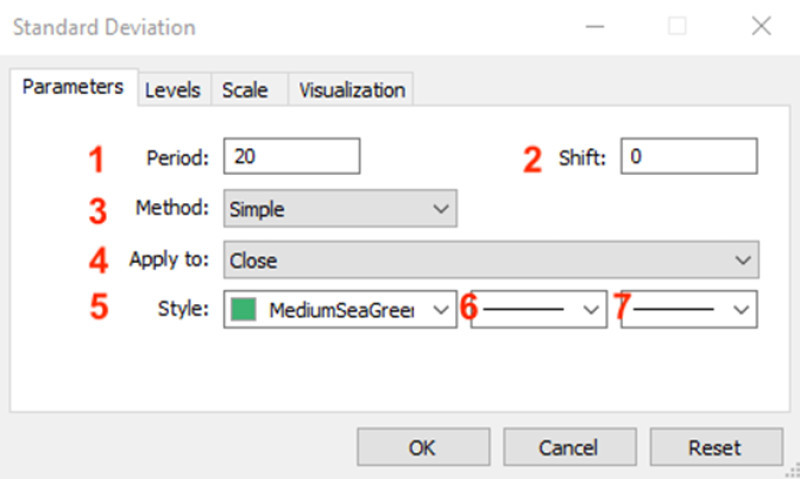
Several parameters can be customized:
- Indicator calculation period
- Indicator line horizontal shift
- Value of Moving Average
- Value of price used for calculations
- Color of indicator lines
- Design of indicator lines
- Indicator line display parameters (most often, thickness)
3. The activated and adjusted tool will appear on the chart in the additional window.
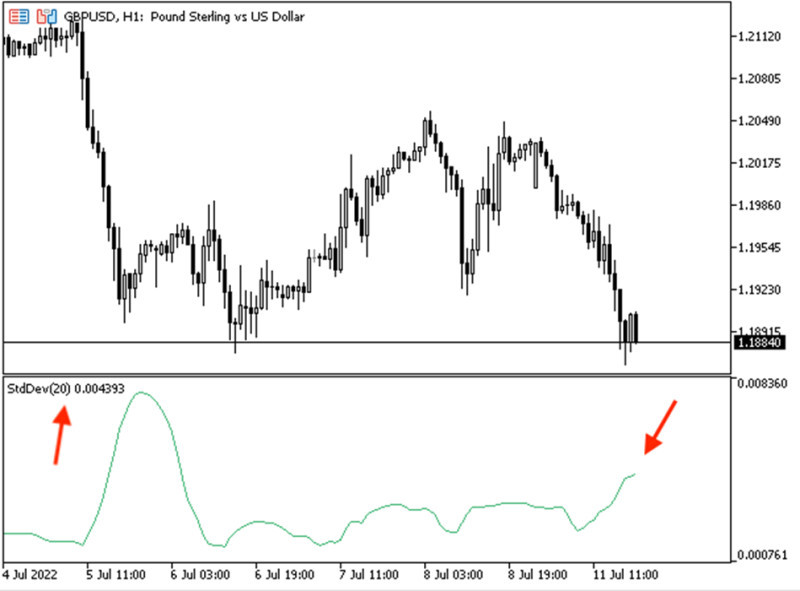
The most important of the adjustable parameters of the STDev indicator is the period for which the moving average is computed. The final data is based on this indicator. The rest of the parameters can be set according to your preferences.
Types of deviation
The distinction between the types of deviation is primarily related to the use of the Standard Deviation indicator. As mentioned above, it is never used as the only tool. Traders combine it with other programs to get a deeper, more detailed, and more accurate market forecast. In this regard, all the typical differences of SD will be related to the strategies in which it is included. Let's look at some of the most common options.
Trading strategies using deviation
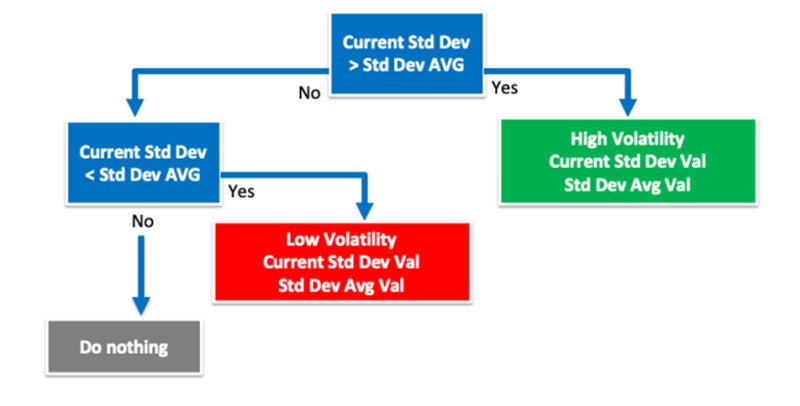
1) Combination of STDev with volatility
First of all, we should pay attention to the volatility and analyze it. To do this, we compare the current standard deviation trading strategy with the average of the previous deviations. The last five deviations are used as a basis. The strategy assumes that the trading system should keep a constant eye on the two indicators.
Interpretation:
• A situation where the SD has a higher value compared to the five-day average is a clear indication of high volatility.
• On the other hand, if the SD value is lower than the five-day average, it indicates a low level of volatility.
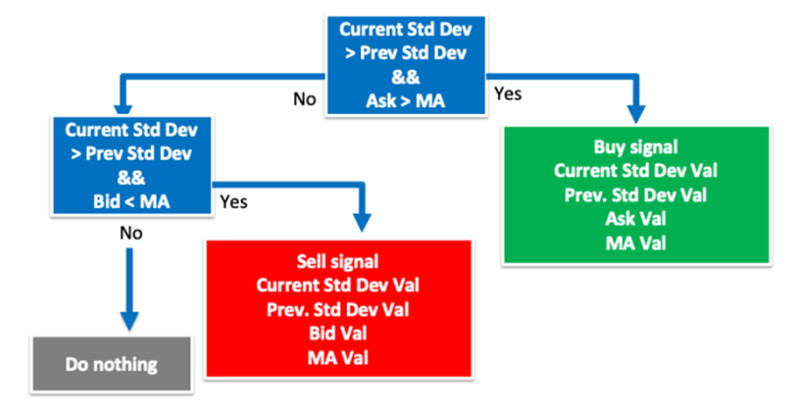
2) Combination of STDev with moving average
This type shows well the moments to buy or sell an asset for a certain period. The strategy requires the trading system to constantly monitor the four indicators.
Interpretation:
• When the SD is greater than the previous period's value and the price is above the moving average, it is a buy signal.
• When the SD is greater than the previous period and the price is below the moving average, it is a signal to sell.
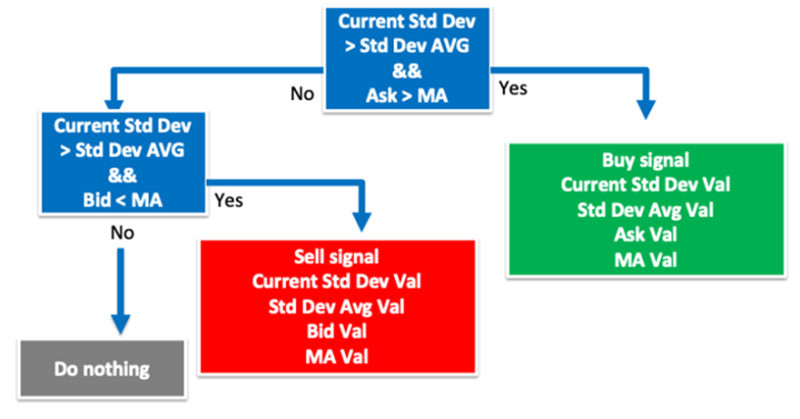
3) Combination of STDev with volatility and moving average
This type will also indicate suitable moments for buying/selling, but it is based on slightly different conditions. The strategy assumes that the trading system should constantly monitor the four indicators and generate signals accordingly.
Interpretation:
• When the current SD is higher than the average of the previous periods and the price is above the moving average, it is a signal to buy.
• When the current SD is higher than the average of previous periods and the price is lower than the moving average, it is a signal to sell.
The strategies presented above are an example of how a fairly simple tool expands trading opportunities.
Conclusion
The standard deviation trading strategy tool is an excellent example of a not-too-complicated mathematical procedure for calculating some values. However, it is quite capable to facilitate trading, as well as make it more qualitative and productive. Its advantages are related to determining overbought or oversold zones of assets.
Trading using deviations is quite suitable for beginners. The STDev indicator is included in the standard set of trading platforms, which greatly simplifies its calculation. However, its single use is impossible due to the limitedness of the analyzed data and totals. Combined with other tools, it gives a good result. Nevertheless, before entering the real market with it, you should check the selected strategy on a demo account.
You may also like:


