


What is a cluster analysis appears in the early 20th century? American psychologist Robert Choate Tryon first applied it in 1939. The method was so successful that it almost immediately spread to other areas. For example, it began to be used in mathematics, medicine, marketing, and trading.
The principle of cluster analysis is the generalization of objects into groups or clusters based on the similarity of their elements. The main focus here will be volumes, delta, and open interest.
This article explains what is trading using cluster analysis.
Understanding what is a cluster analysis in trading
A cluster is an association of several homogeneous elements, considered a separate entity with its characteristics.
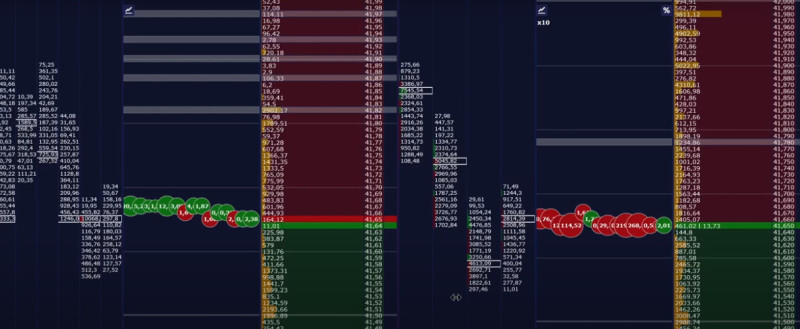
The essence of CA for the Forex market is as follows: homogeneous elements are transactions of the same price, whose total volume forms a cluster, and appears in trading for a certain period. Simply put, the cluster is the total volume of buy/sell trades with the same price for the given period. Therefore, the evaluation of trades and their volumes is the result of clustering analysis. As a result, a market participant has a more precise understanding of the direction in which the price of the asset may move next. Clusters give a complex picture of market volume.
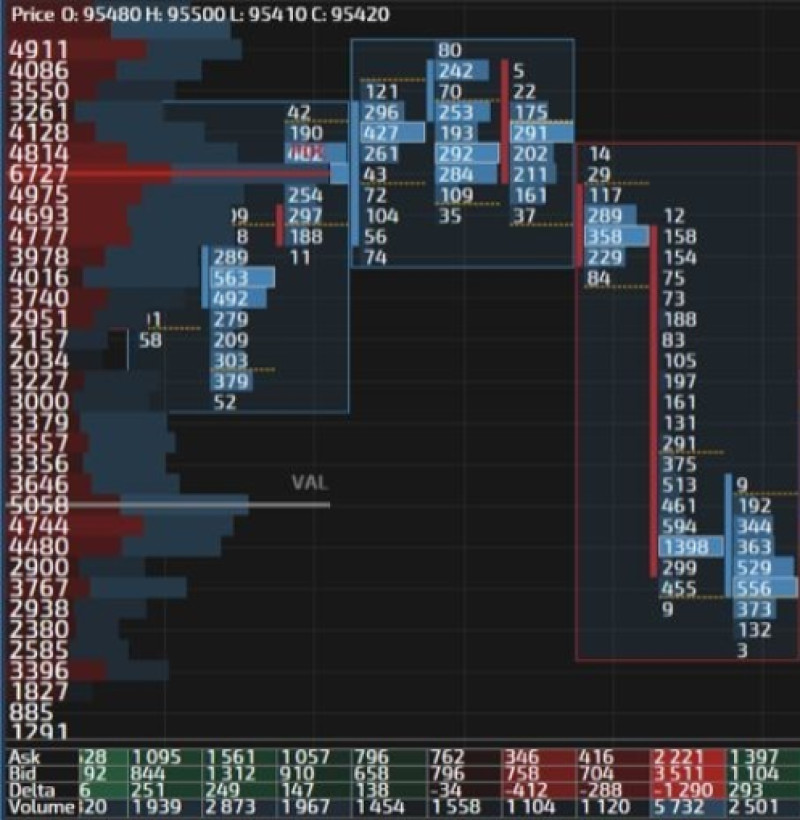
A table immediately records the moment when a trade becomes active in the market, i.e. when a buyer and seller have agreed on the counterparty's price. CA starts by clustering all recorded transactions, that is, defining their characteristics. It is the total volume of the buy and sell transactions that are displayed on the price levels of the cluster chart. In this way, the trader can get a detailed description of what is happening during the formation of the candlestick.
All transaction orders can be divided into two groups:
1) Orders with large amounts, they are also called professional players
2) Orders with small amounts are called small traders.
CA allows you to see what big players are doing at the moment. You can watch their trades (buying or selling), volumes, and prices. If the trades are made in the same price range, which is limited by the boundaries of a single candlestick, their volume will add up, which allows traders to make a more accurate assessment of the recent market trends.
As a result of such analysis, the trader will be able to see the exact volume of trades made in each price segment, and therefore it will be possible to use this data to perform the following:
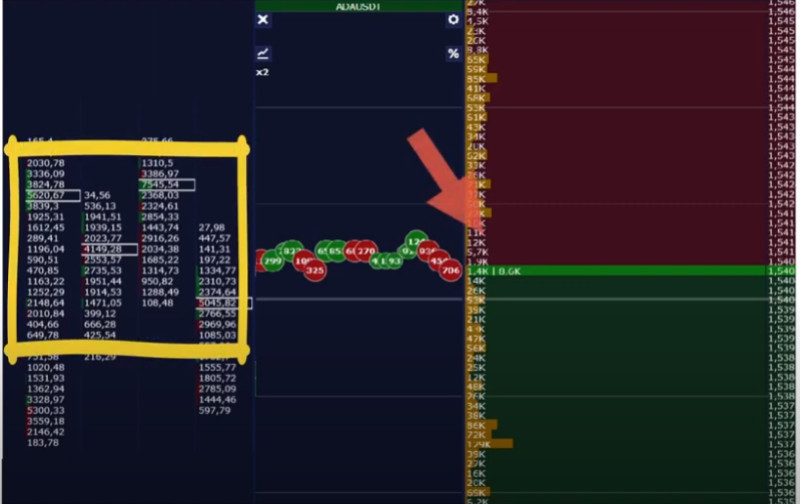
• Determine support and resistance levels in volume terms. The large volume accumulations detected on the chart allow traders to estimate the further trajectory of quotes and define the future key levels. The price will show a reaction.
• Determination of the direction of the market trend, that is, the predominance of buyers or sellers. The delta is an indication of a future trend.
The main point of cluster analysis is the fact that traders can monitor transactions of other traders using price bars. It is rightly considered one of the most detailed analyses compared to others. Its accuracy is determined by the inclusion of every transaction made in the market. Specified mathematical operations automatically combine transactions according to appropriate criteria, which in the output gives a distribution of prices by volume. It is this price chart that we call cluster analysis.
Two main points of cluster analysis:
1. Market Delta. It represents the difference between active purchases and sales for a predetermined period (time frame).
There are two types of market delta:
The first type is positive delta when a candlestick (bar) has more purchases.
The second type is negative delta when the advantage is on the side of sales.
Important: the dominance of buyers indicates that the price will rise. The reverse situation when sales are leading, indicates a further decline.
The difference, which is obtained by comparing one delta, cannot be used separately; it gives insight into what is going on only in the general context of other candlestick deltas. It is after their generalized analysis that we can judge a clear preponderance of this or that trend in the market.
Types of delta:
| Moderate delta | Flat. Approximately the same number of buyers and sellers in the market |
| Normal delta | Trend. One side prevails in the market |
| Critical delta | Points to a trend reversal and a new market trend |
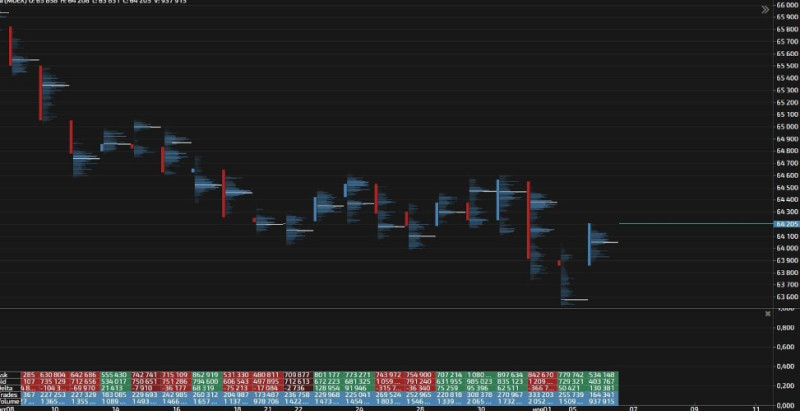
2. Market Profile. It represents the volume of transactions made at each specific price level within a time frame, more often one day, or in the aggregate for the required period. The market profile perfectly demonstrates the maximum levels, where the volume appeared in the given period. Thus, the price zone is analyzed, after the penetration of which in the opposite direction to the volume, there are factors for the triggering of stop-loss orders and for the formation of momentum.
Cluster analysis is trading with a fairly short history. It is a relatively young direction of analysis, but it is already widespread and popular among traders. Its main advantage is the possibility to build really strong resistance and support levels, which will work much better than other indicators.
What cluster analysis shows
Using only cluster analysis in the market is impossible, it is necessary to use other indicators. In addition, it is necessary to have a clear idea of what can be obtained with the help of such analysis and what it cannot show.
What is a cluster analysis allows traders to answer five important questions for the trader:
- When?
- How much?
- At what price levels?
- Who took the initiative in the trade? (sellers or buyers)
- With what margin over the other participants?
Thus, CA allows traders to know:
- The volume of traded contracts at each price level within a bar.
- The total volume of trades at the seller's price (Ask).
- The total volume of trades at the buyer's price (Bid).
- The total volume of traded contracts.
- Delta - the difference between the volumes of buyers and sellers.
- Market Profile.
Depending on the type, cluster analysis is most often used to demonstrate:
1. Levels, where the largest volumes are poured into the market. Usually from such levels are prepared for further price rebound, which happens with a high probability.
Important! These cases involve the use of a market profile because then you can find out the exact prices.
2. The prevailing market trends (more sellers or buyers). By the difference, it will be possible to determine with high accuracy, where the price will move in the future.
Important! Only delta can be applied in such cases.
As a rule, traders distinguish three types of clusters according to the area where the maximum volume of traded contracts is located:
- Shakeout (drive down) clusters - they stop and reverse the price
- Thrust (drive up) clusters - create upward movement, i.e. price rise
- Undefined clusters.
The latter are not important for traders, as they do not contain any useful information. At the same time, the first two types allow us to conclude the price movement.
Variants of shakeout and thrust clusters (bars)
| Thrust clusters (bars) | • DU1 - the maximum volume is in the lower tail of the bar. Between it and the body of the bar, there is a gap of several ticks. The greater the gap, the stronger the cluster (bar); • DU2 - the maximum volume is at the opening price of the cluster (bar); • DU3 - the maximum volume is in the lower half of the cluster body (bar). Bearish thrust clusters (bars): • DD1 - the maximum volume is in the upper tail of the cluster (bar). There is a gap of several ticks between it and the body of the bar. The greater this gap, the stronger the cluster (bar); • DD2 - the maximum volume is located at the cluster (bar) opening price; • DD3 - the maximum volume is in the upper half of the cluster (bar). |
| Shakeout clusters (bars) | Bullish shakeout clusters (bars): • SU1 - the maximum volume is in the upper tail of the cluster (bar). Between it and the body of the bar, there is a gap of several ticks. The bigger the gap, the stronger the cluster (bar); • SU2 - the maximum volume is at the closing price of the cluster (bar). Bearish shakeout clusters (bars): • SD1 - the maximum volume is at the lower tail of the bar. There is a gap of several ticks between it and the body of the bar. The greater this gap, the stronger the cluster (bar); • SD2 - the maximum volume is at the closing price of the cluster (bar). |
Analysis using clustering at first glance is very similar to the familiar to all traders Japanese candlesticks, but a detailed analysis reveals distinctive features.
Features of the graphical images of CA:
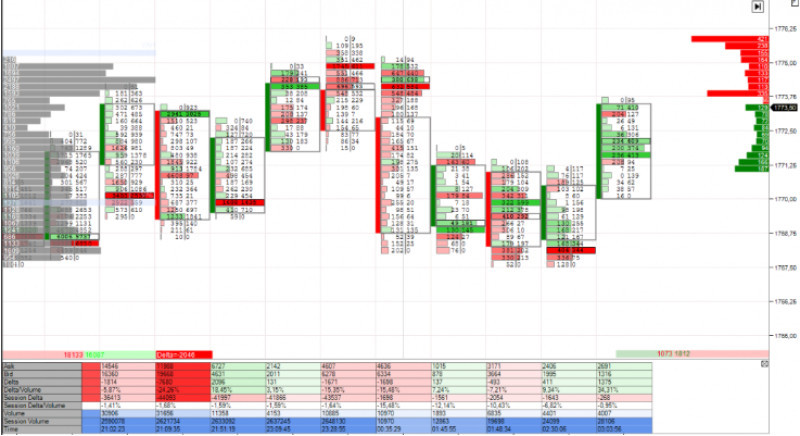
1. Clusters (bars) are displayed on the chart in proportion to the level of value. Elements with volumes pass to the category of completed.
2. Large volumes are colored, which is convenient when fixing the moments of entering one or another position in the market.
3. The delta in red or purple is an indicator of participants who occupy the leading positions in the market at the given period.
By using the convergence and divergence indicators, which are well-known to traders and have become standard, it is possible to confidently determine the point of delta transition from one position to another in the cluster (bar). The most profitable position can be found if we precisely catch the moment of the beginning of their purple area departure. It is at this point that the maximum profit is fixed. Knowing this, it will not be difficult to determine the following indicators:
- Significance of indicators of distribution, volume priority of a particular object of trade;
- The importance of support and resistance level indicators.
This is what allows traders to determine the most appropriate time to open trades to get the maximum profit.
What is a cluster analysis in scalping
The only indicator that helps a trader to work and make a profit is volume. Volume, in its turn, is an element of CA. The ability to work with volumes, to make correct forecasts will help not only in scalping but also in medium- and long-term trades.
In trading, scalping is a particular style of trading characterized by making a great number of small-volume transactions on the rise or fall of a security's price. Each such transaction has a high risk of capital loss, so the more transactions, the more risk occurs. To decrease the risk, traders use cluster analysis to work with the scalping strategy which allows more detailed and profound study and understanding of the market situation.
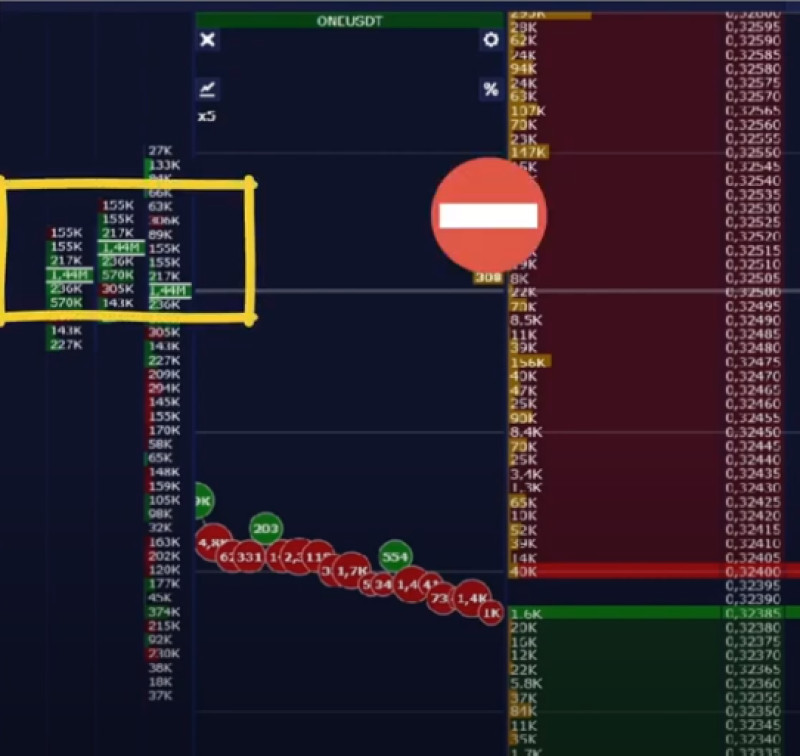
It helps to take a closer look at the passing trades, namely to find the iceberg of orders and large accumulations of volumes. For full-fledged trading, it is necessary to understand the aggregate strip of trades, i.e. the function of the stock market slip, based on fixing of strikes to the market. The bumps are usually called the throwing-in of large bids. It is necessary to see the point of the strikes to identify the start of an impulse movement. It is the impulse movement that scalpers hunt for.
For scalping, the component of the cluster (bar) itself is important. It is based on the change of internal coordinates that the work is built. Internal coordinates include:
- Time
- Price
- Volume
For scalping, the trader's interest in a certain price level will be crucial. Analysis using clusters allows looking at the movement of this price from within, which is very convenient and opens up great opportunities for effective work.
Important! It is more relevant to use the five-minute time frame for scalping.
Features of using cluster analysis in scalping:
1) Identification and analysis of the control point. The control point - the highest recorded price during the five-minute timeframe. It is used in scalping for the strategy of trading on the rebound from the level. It means that the highest buy price is inevitably followed by a downward correction. It is this moment of correction that scalping amateurs catch.
2) Using clusters, it is possible to determine not only a good time to enter the trade but also to exit it. When the price is stuck between some large volumes, it is better to either close the trade or leave a small part of it.
3) The resistance level is used to either start a pullback on a price rebound or to close when the price stays in it for a long time and the price movement slows down. The pressure from above, that is the accumulation of large volumes at the top of clusters (bars), pushes the price to the subsequent bounce. This is the moment traders are interested in.
Thus, cluster analysis makes trading comfortable not only for scalping but also for other strategies. However, it is the scalping strategy that has become widespread due to its unique features. Its main advantage is the detail and accuracy of the information displayed. This is exactly why it is valued by experienced traders. It's quite difficult for beginners to understand without prior training.
Best algorithms to build cluster charts
Today, almost every platform has an indicator for plotting cluster analysis charts. However, they are not always easy to use, and most importantly informative. That is why very often experienced traders resort to purchasing third-party programs with broad functionality and clarity.
Five tools are especially popular. They are good tools for determining the activity of the major players, which directly affect the whole market, as well as a single asset. All indicators have their advantages and disadvantages. The distinguishing features of these programs are presented below.
Top 5 programs for cluster analysis
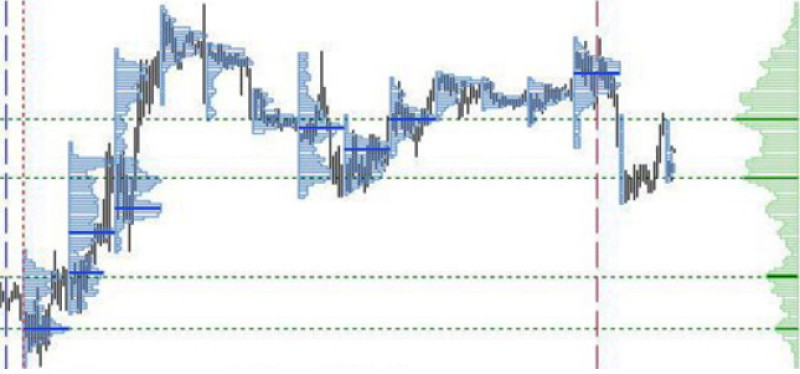
1. High Volume Bar Vertical Histogram indicator.
It is considered one of the best programs for determining the cluster market volumes. A distinctive feature: it has a function of demonstrating single values of volume for any time frame up to four hours. The raw data is set up to be automatically obtained at a one-minute time frame.
The indicator provides the following:
- Resistance level
- Support level
- Uncertainty level
Each level can be distinguished by the line color. The calculation is carried out according to a given number of bars, which is called a calculation period.
The advantage of HVBVH is due to the ability to display strong levels for the past period as well as for the current moment. This makes the analysis more accurate and up-to-date.
The second version of the program includes a function to display the strength of the level as a percentage. No other modifications were made.
Most often this indicator is used to determine the most probable direction of price movement. It helps to conduct good work both with the use of classical strategies, and trading strategies using the opposite approach.
2. TPO and TPO-Range indicators.
The programs have gained popularity among traders. They also can identify strong price levels, i.e. support and resistance lines, and mark them on the chart.
The indicators look like bar charts, which are displayed near price levels. They are similar to classical cluster volume indicators, which are usually used in trading in the futures contract market.
The very first version of the program showed itself well in intraday trading because its main task is to work exclusively with new chart data. Moreover, the basic version is recommended to work only with a limited number of timeframes - from one minute to four hours.
If there is a need and a habit to trade with a medium- and long-term perspective, it is better to use another, more advanced, version of the software - TPO Range.
Important! The updated version of the indicator should be installed directly over the old model, only then it will work correctly.
The main condition for using the TPO and TPO Range is not to rely only on them. They work well as additional indicators that provide confirmatory trade signals. As a rule, they are combined with other programs, for example, performing the algorithm on the type of scholastic. Then TPO and TPO Range become a kind of filter that can show the trader such control points on the chart as key support and resistance levels.
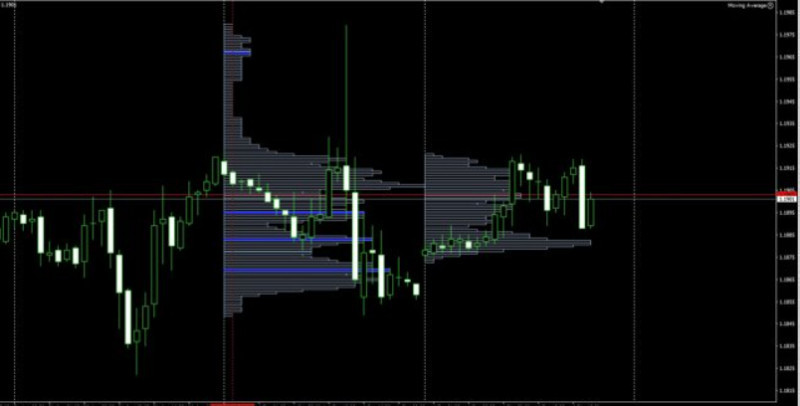
3. Cluster Volume indicator.
This program is an example of a new generation of programs for cluster analysis. It is sharpened to show the total trading volume for each cluster (bar) on the chart separately. In this case, it necessarily takes into account the specific price and time of buying/selling the asset.
The tool represents a histogram. Its columns consist of volume clusters (bars).
This is the only indicator from the list, which is freely available on the Internet.
Important! It is necessary to install it correctly on the trading platform. First of all, it is required to download and unpack installation files. Then they should be copied into the folder "Indicators" located in the data folder of the terminal. After this procedure is complete, you should restart the terminal, only then the indicator will be active and ready to work.
The advantage of this tool is that it works almost without delay. The price and order of trading volumes at any point of the chart are demonstrated instantly. Namely, it is very convenient to see how the volumes were distributed, for example, in the consolidation zone, at the reversal points, or near the support and resistance levels. This information is very useful for making a final decision to open or close a trade.
4. Ninjatrader indicator.
The peculiarity of this tool is that it can divide pairs into separate currencies and show the main values for each one separately. Thus, the following functions will be available to the trader:
- Indicate the volatility of the price of each currency in the pair separately. This helps to compare the values obtained with other assets.
- Predict the development of buying or selling trends, i.e. bullish and bearish trends. It also gives an estimation of the strength and duration of the incoming trend.
- To get clear signals for entering the market.
- Track the progress of medium and long-term trades. If necessary, for example, if a sharp change of trend, you can immediately close active orders.
Notably, Ninjatrader does not work too well in short-term trading, where there is a small time frame. It is best used when trading on charts of one hour or higher.
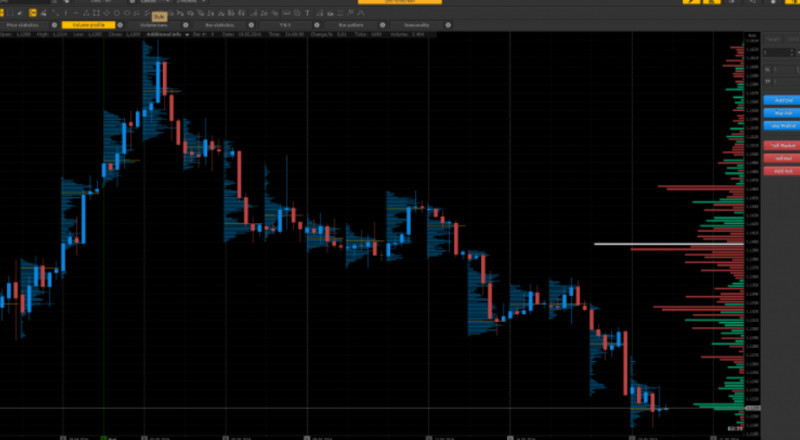
The indicator is a histogram of clusters (bars). The histograms are located on top of the price chart and have three colors - red, blue, and light blue.
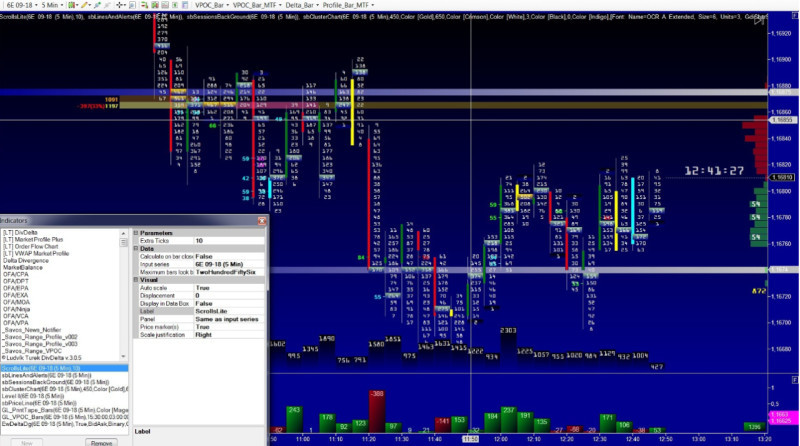
The program allows you to see and evaluate the distribution of trade volumes for buying and selling the asset. You can also determine the probability point of price rebound from support or resistance levels.
5. ThinkorSwim Online Indicator
It is not necessary to download the program and install it on your device to use cluster analysis in trading. Some online projects allow you to do this without any additional settings. One of the most popular ones is ThinkorSwim. It is essentially the same cluster analysis chart that shows volumes, only online, not on our computer.
There are currently two versions of the indicator available to traders - paid and free. The second one is much more limited and restricted, so it is recommended to use the paid version. The free version is more often tested by beginners and inexperienced traders to develop their skills and training.
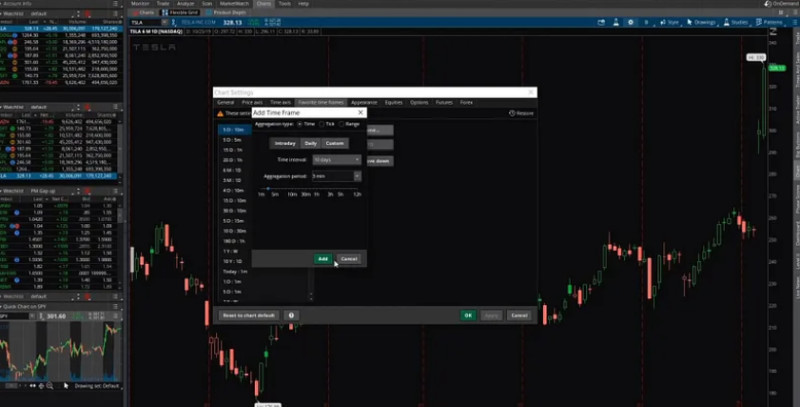
One of the most serious disadvantages of the indicator is its user interface. However, the developers have made adjustments, now it is possible to customize it. To do this, you need to find the Settings button.
Conclusion
What is a cluster analysis can be quite helpful in trading. It allows looking at the price movement from within. However, it is better to use it as an additional tool, for example, in a bundle with fundamental analysis. It works great as a filter that allows you to make the right trading decisions. Cluster analysis is aimed to minimize your potential losses.
It is also a perfect method of market forecasting. The application of such analysis helps a trader to find meaningful levels and price ranges, the formation of which is confirmed by the real interest of market participants.
CA is one of the popular tools for traders using scalping because it reflects more accurate data and allows them to trade more efficiently in the market.
You may also like:
Standard deviation trading strategy


