


Trading is now available to everyone and not only to large market players. To start trading, you don’t necessarily need to have large initial capital or any special education. Your desire and the basic training will be enough.
Start with the theory and read our article What is trading? It will introduce you to the main concepts of trading in financial markets.
Today, we will discuss divergences in trading. What are they, how do you spot them on the chart, and how to use them for opening/closing positions?
Understanding divergence
First, let’s find out what this word means. Usually, a divergence means some kind of discrepancy in indicators, characteristics, or data.
You can come across this term in many spheres of our life. For example, in macroeconomics, a divergence reflects differences in the economic conditions between countries.
In biology, it means the division of species in the process of evolution associated with the conditions of their residence. For example, polar and brown bears as well as grizzlies and pandas live in different parts of the world.
When it comes to trading, a divergence happens when the price of an asset contradicts the indicator direction.
For example, the price is steadily rising on the chart and persistently develops a bullish trend while the indicator is demonstrating a decline. This is a clear signal that the current price action is losing its momentum and there is a certain imbalance between bulls and bears.
See an example in the screenshot below.
Any imbalance in the market signals that the existing dynamic is losing steam, and either bulls or bears are retreating. The price movement is about to exhaust momentum.
This phase is usually followed by a reversal or correction, meaning that the existing trend is nearing its completion.
In other words, a divergence is the opposite of confirmation which is when the indicator is moving in the same direction with the price.
Different indicators can be used to spot a divergence. For example, the MACD indicator, the Relative Strength Indicator (RSI), the Stochastic Oscillator, and others. Both momentum indicators and oscillators can be used for this purpose.
To confirm the fact of a divergence, you need to spot it at least twice at highs or lows although the frequency could be higher.
A divergence helps define a possible change in the trend, providing more information for a trader on whether to go long or short.
Divergences do not occur very often but are considered reliable signals. The opportunities for profits increase when volatility is high.
The best thing about this tool is that it predicts a possible reversal in a trend before it actually occurs.
This does not mean that traders should rush to open positions against the current trend. But they can potentially use the divergence pattern to look for entry and exit points on time frames higher than H1.
Types of divergences
There are several approaches to divergence classification.
In the first classification approach, a divergence can be bullish or bearish.
A bullish divergence occurs when the price is making lower lows, thus demonstrating a bearish trend. Meanwhile, the technical indicator does not confirm a decline and reaches higher lows.
On the chart, the lows of the price and the indicator are moving closer to each other which is also called a convergence, which is part of a divergence in this case.
This is the moment when short positions should be closed or stop-loss orders should be shifted. It is also a good time to open buy positions as the market may soon turn bullish.
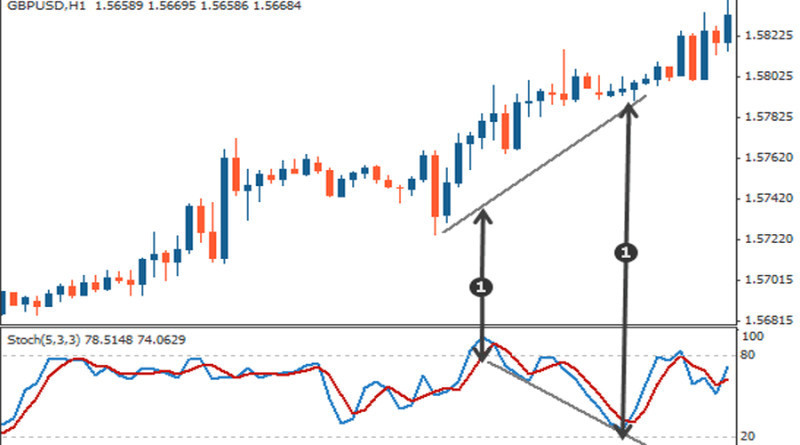
A bearish divergence happens when the price is hitting higher highs, while the indicator stays at the same place or declines.
On the chart, the two lines of extremum points are widening.
In this case, traders should close long positions or shift stop-loss orders and open sell trades as a bearish trend is about to start.
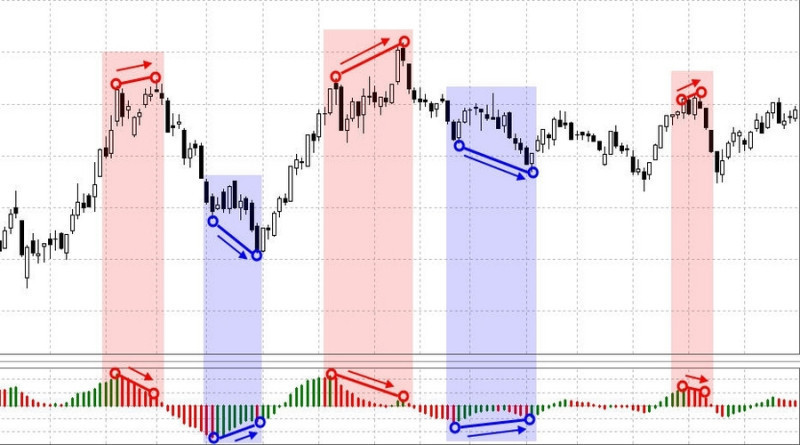
In the screenshot below, you can see two types of divergence in the Relative Strength Indicator. The bearish divergence comes first and then the bullish.
Each of them was followed by a reversal which could have brought profits.
Both bullish and bearish divergences can be of three types.
The first one is the strongest divergence type. In a bearish scenario, the price is hitting higher highs, while the indicator is hitting lower highs. In a bullish scenario, the price is making lower lows, while the indicator is reaching higher lows.
In the second type, the highs or lows of the price do not change significantly or stay at almost the same level. Meanwhile, the oscillator is moving in the opposite direction.
In the third type, price fluctuations are moderate while the indicator is stable. This is the weakest type of a divergence.
This is when you can see the Double Bottom or Double Top patterns being formed on the chart.
The second classification approach suggests that there are regular and hidden divergences. The regular type has been described above.
A hidden bearish divergence occurs when the price makes lower highs but the oscillator is making higher highs. This is a signal confirming the downtrend which presents a good opportunity to go short on an asset. But make sure you don’t open long positions.
If the price is making higher lows while the oscillator is declining, this is a hidden bullish divergence indicating that the uptrend is still strong and is going to continue.
Therefore, it is the right time to exit sell positions and enter buy positions instead. This is relevant only if a trader manages to enter the market before the end of the trend.
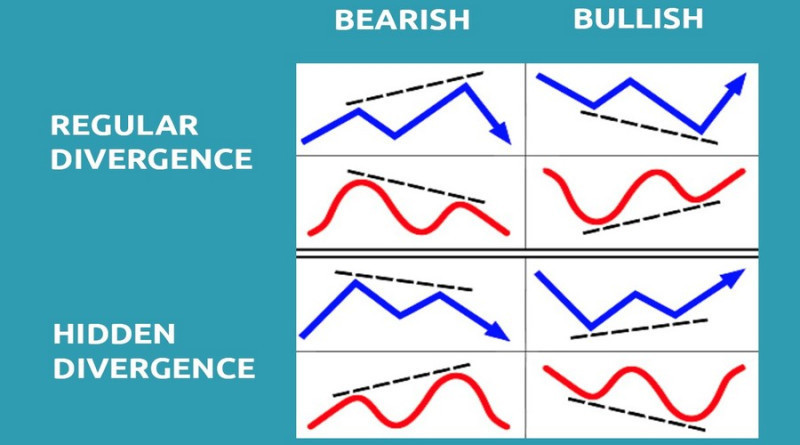
So, with a regular divergence, a trader should be looking for a possible reversal. With a hidden divergence, a trader should count on a trend continuation.
To avoid confusion, just remember in which cases you should analyze highs or lows and in which direction they should be moving.
Using divergence in trading
Knowing how to use a divergence in trading allows you to predict the upcoming trend. If this prediction is accurate, you can open positions in the right direction or exit the existing ones.
Basic principles of divergence trading:
- A regular divergence signals a reversal in the trend while a hidden divergence confirms its continuation. Keep this in mind when looking for the best entry and exit points.
- The tool can be used on any time frame and with any asset. Remember that the higher the time frame, the more reliable the signal is. Oscillators can also be different.
- All generated signals should be confirmed with the help of additional technical analysis tools.
- A divergence does not show the strength of the future movement but simply suggests its direction. The upcoming trend may turn out to be weak or may turn into a sideways movement.
- The number of highs or lows needed to define a divergence ranges from two to five.
- Sometimes a divergence can be used to set a Stop Loss.
- It is better to stay out of the market when important macroeconomic reports are published.
When looking for a divergence, most traders prefer to use the MACD indicator or the RSI.
The RSI determines overbought and oversold conditions. When the indicator has entered one of these zones, this is a strong signal of a divergence.
So, for opening a position, make sure that the RSI stays above 70 or below 30.
As for the MACD indicator, the bars of the histogram should be located above or below the zero line. If the bars cross the zero line, the signal is no longer relevant.
To identify a divergence when using MACD, either the baseline or the histogram of the indicator should be analyzed. The MACD signal line should not be considered.
The best time frame for using MACD is 1 hour although other time periods can also be used. It depends on the strategy a trader has chosen.
Apart from the above-mentioned indicators, you can also try the Stochastic Oscillator. It works similarly to the RSI and determines overbought and oversold zones.
H1 is the most suitable time frame in this case. In this case, we use the indicator’s main line for analysis.
Another option to find a divergence is with the help of volume indicators. For example, if the price sets new highs but trading volumes decline, this means that market participants are losing interest in the asset.
This information can be interpreted as a sell signal.
Trading volumes are important to consider even if the user works with the MACD, RSI, or Stochastic Oscillator. For this, on-balance volume and other volume algorithms are utilized.
The Awesome Oscillator, momentum indicators, and a number of other algorithms also search for discrepancies in trading. Their functioning is similar to that described above.
Examples of divergence in trading
To trade divergence, the following steps are required:
- Define the current trend on the chart by using a trendline and connecting extremum points.
- Choose an indicator and add it to the chart.
- Find the divergence yourself by looking at the chart or with the help of special indicators that we will discuss below.
- Check the signal. This could be a breakout of the trendline which confirms a reversal.
- Open a position and set a stop-loss order.
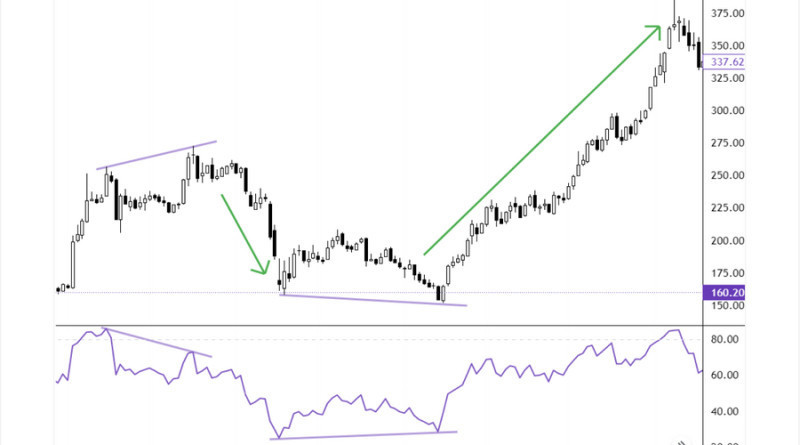
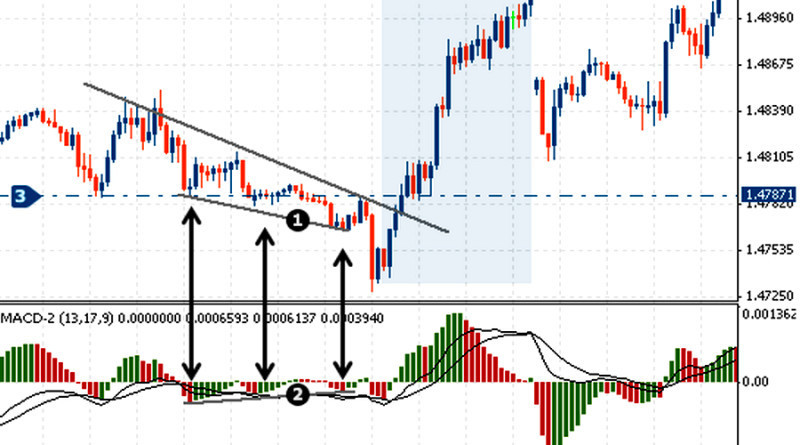
At the left bottom of the screenshot below, the price is moving downwards as it is hitting lower lows. At the same time, the MACD indicator is making higher lows.
This means that we are dealing with a divergence.
The breakout of the trendline serves as a confirmation of the reversal signal. This is a good time to open a long position.
Apart from a trendline, you can also use moving averages and support and resistance lines. In these cases, a breakout also acts as a confirmation.
Quite often, traders combine different time frames when trading divergence. Longer time intervals are good for defining a trend, while shorter time periods are suitable for finding entry points.
By doing so, you can spot several good entry points so that you have something to choose from depending on your strategy.
Traders are recommended to stick to their trading strategy, especially if they are new to the market. A divergence is a means of implementing a strategy, not adjusting it.
How to set Stop Loss and Take Profit
We have mentioned several times that setting a Stop Loss and Take Profit is essential for any trading strategy. These tools are necessary to minimize losses as traders can not always monitor the chart.
Here are the main principles of setting stop-loss and take-profit orders:
- In case of a convergence, set a Stop Loss below the price low. If the price moves against you, your losses will be minimal;
- In case of a divergence, place a Stop Loss above the price high.
As can be seen on the chart below, MACD is forming a bearish divergence. The stop-loss order should be placed above the high of the price. This is done in case the price does not reverse and continues to rise. The Stop Loss is presented with a red horizontal line.
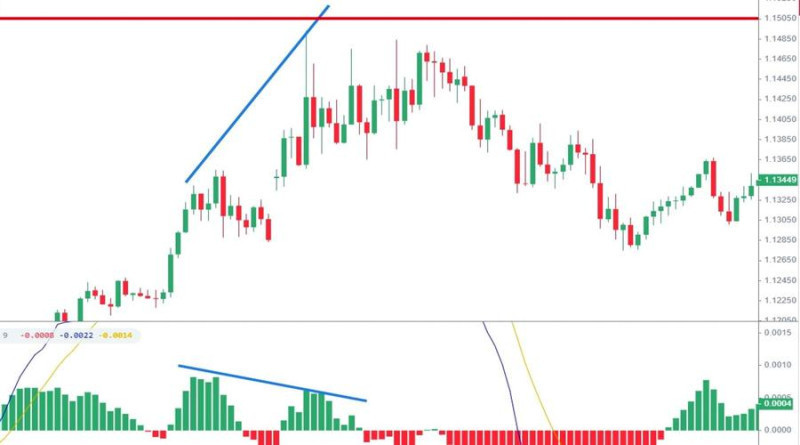
As for the Take Profit, it is best to set it at a distance twice as long as the distance between the entry point and the Stop Loss. Experienced traders can place it even higher to maximize profits.
If the stop-loss order is located above the high, then the take-profit order should be placed below the entry point. If the stop-loss order is placed below the low, then the take-profit order should be located above the entry point.
You can close positions manually after getting signals opposite to those that were used to open trades.
In other words, you need to spot a divergence that is opposite to the previous one. If the signal is confirmed, you can exit the trade.
How to identify a divergence
You can spot a divergence yourself but this can be a time-consuming task, especially for beginners.
There is an array of different scanners, indicators, and notifications to make this process easier for you.
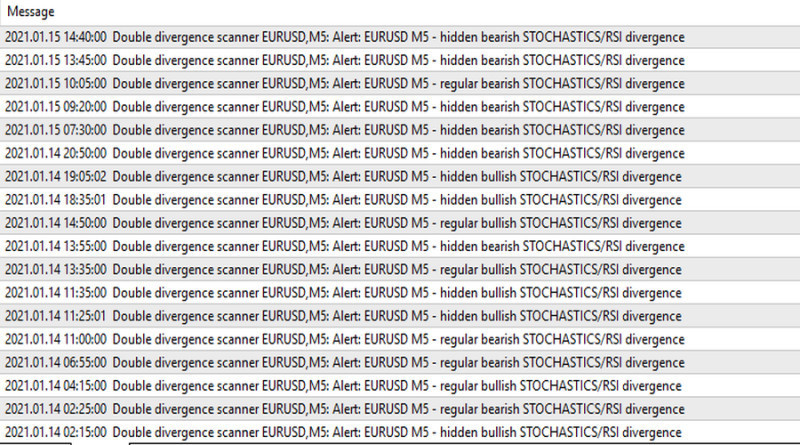
For example, the Double divergence scanner can spot a divergence on various indicators at once, including the MACD, the Stochastic Oscillator, the RSI, the Awesome Oscillator, Bollinger Bands, and others.
Markets and assets can be chosen in the settings. Available time frames are from a 9-minute to a monthly one.
When coming across a divergence, the scanner will notify the user in real time. Divergences are displayed on the chart and in the notification window.
Another option is the Divergence Panel. After downloading and adding it to the MetaTrader platform, you can simply drag this indicator to the chart of the selected asset.
In the settings, you can change time frames as well as the list of currency pairs.
The Divergence Panel is located at the bottom of the chart. The user sees a list of all found divergences for different assets and time frames.
If you click Chart in the indicator panel, the system will open the chart of the trading instrument.
The Divergence Panel is a very simple tool, so it is often used by beginners. However, they should avoid using it on H1 charts or below.
Otherwise, generated signals will be less reliable, and the trading speed will be high. A beginner may simply get confused and may lose a deposit.
What to keep in mind when trading divergence
Divergence-based strategies are not as simple as they seem. Divergence trading should be built on a particular trading system and the basic rules of the method.
Here are some of them:
- You should not solely rely on a divergence even if it is a strong one. Both divergences and convergences can last for a long period of time without any reversal coming.
- Not all reversals are preceded by a divergence. This usually happens during the release of important macroeconomic data when the trend changes suddenly without any indicator signals.
- When looking for a divergence, remember that you should build a line between either the highs or lows of the price and the indicator. Do not use the high of the price and the low of the indicator.
- If you have spotted a divergence that was followed by a reversal, and the price has already moved in the new direction, this divergence is over. Do not open new trades and start looking for new signals.
- It is recommended to use a higher time frame: it will show fewer but more reliable signals.
- Do not rush to open a position and wait for a slight pullback. In case of a convergence, wait for a bullish candlestick and then enter the market.
- Start trading on a demo account first or try looking for divergences in the history of quotes. This way, your deposit will be safe even in case of a loss.
- Pay attention to the direction of the price chart and indicator. Ideally, they should be different. It can be either an upward or a downward dynamic or the lines can move horizontally.
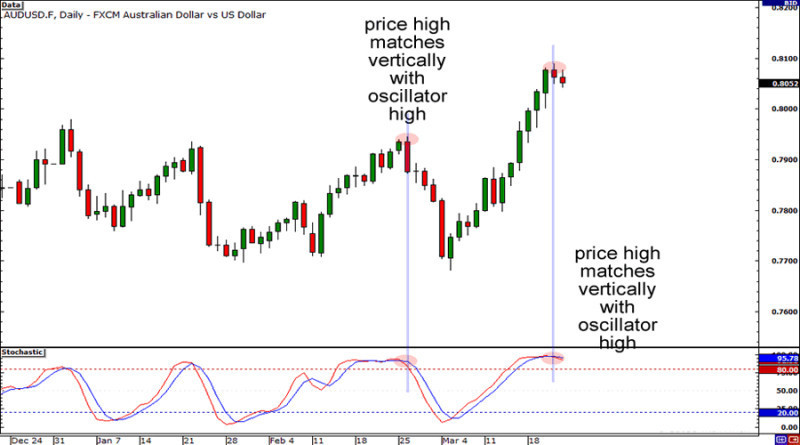
- Make sure that the highs/lows of the price are on the same vertical line as the highs/lows of the indicator. There shouldn’t be any shifts.
Common mistakes
Beginners may sometimes find it difficult to master the divergence strategy which may result in financial losses. To avoid the risks, novice traders can try their hand at trading on a demo account.
Below are some common mistakes that traders make:
1. Focusing on the lows of the price chart and the indicator when trying to find a divergence. Some traders think that if the indicator is declining, they should monitor the lows on the price chart and vice versa.
Such an approach is wrong. It is essential to focus primarily on the price chart. Only after defining a trend and extremum points can you check what the indicator shows.
2. Connecting the highs of the neighboring bars or candlesticks without making sure that these are the highs or lows of the current trend.
3. Taking a slight discrepancy in the direction of the price and the indicator for a divergence. It is important to monitor the lines connecting extremum points to define a divergence correctly.
4. Using highs/lows formed at a different time. For example, they have been formed earlier on the price chart but a bit later on the indicator chart. This violates the above-mentioned rule which states that highs/lows should be located on one vertical line.
5. Trading divergences that are coming to a completion. It is too late to enter the market when the price has already reacted to a divergence and has begun to move in a certain direction. It is better to wait for the next signal.
6. Treating a divergence solely as a reversal signal. As we have already discussed above, hidden divergences can indicate the great potential of a trend and signal its continuation.
Conclusion
A divergence in trading is what happens when the price of an asset is moving in the opposite direction than the indicator.
It can be of different types. A regular divergence suggests trend exhaustion and an upcoming reversal.
A hidden divergence is less common and it signals the continuation of the trend.
This technical tool is multifunctional:
- Multiple indicators can be used to find divergences but oscillators are more common.
- It can be applied to various markets and time frames.
- It generates signals on both ascending and descending markets.
However, a divergence should not be used as a standalone tool and is better combined with trendlines, support and resistance levels, and so on.
You may also like:
Standard deviation trading strategy


