


Activity in any field begins with knowing its basics. Trading in financial markets is no exception.
What is trading, how does it happen, how much do traders earn and what does their income depend on? You will find answers to these and other questions in our article.
Trading in nutshell
Financial markets are evolving non-stop, becoming increasingly popular with people willing to make money there. Every day, thousands of transactions with different assets, including currencies, securities, and commodities, are made on exchanges, allowing people to earn a certain income.
Trading is about conducting trades in the market to increase capital.
Put simply, one who decides to trade intends to yield enough funds to exceed the size of initial investments.
Unfortunately, it is not always the case. Sometimes, traders suffer losses.
This could happen for various reasons but most often due to the lack of theoretical knowledge and practice.
To understand the essence of trading, it should be compared to business rather than to a regular job.
Common features of trading and business:
- Start-up money. The higher the amount, the larger the profit.
- Theoretical knowledge and mental preparation. Future business people usually study the market and competitors and develop a business plan at this stage. Meanwhile, traders gain theoretical knowledge.
- Risks. In both cases, there are no guarantees. Therefore, traders should be prepared for uncertainty.
- Results largely depend on the experience, knowledge, and personalities of businesspeople and traders. Trusting only in luck is the road to failure.
Earning money by trading has never been easy. Like any other job, it requires having certain knowledge and skills.
At the same time, it is wrong to think that what is trading in financial markets is not for everyone. Every year, it becomes more accessible thanks to the abundance of information and training content about it.
Essence of trading
To generate income, an asset is bought at a low price and sold at a high one. This is the basic principle of trading.
If one trades stocks or commodities, they receive a profit only if the asset price goes up. In this case, the trader sells an asset at a higher price after buying it at a low one, thus expanding the amount of money in the account.
At the same time, traders can make money when prices go down. For example, if they trade currency pairs.
When the exchange rate changes, one currency gets cheaper than the other one, which, accordingly, rises in price. By developing an efficient trading plan, the trader earns on such fluctuations.
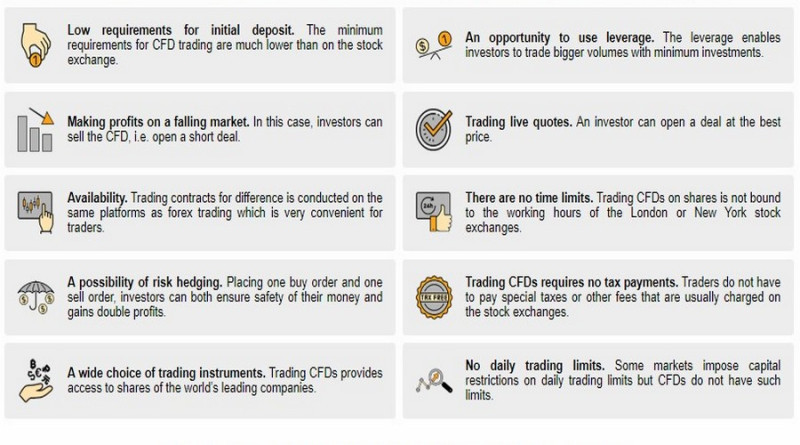
Profits can be also made from a decrease in prices when trading derivative instruments such as CFDs.
With InstaForex, you can work with plenty of assets without buying them by simply making a forecast for an increase or decrease in their value. If your prediction comes accurate, you make a profit.
This is the essence of trading contracts for difference (CFD).
Trading principles:
- Buy an asset at a low price and sell at a high price.
- Always stick to your trading plan and strategy. Without them, all you do will hardly bring the desired result.
- Use technical and fundamental analysis. The choice depends on your strategy.
- Abide by money-management rules. The main thing you should do is accurately determine the risk/profit ratio.
First steps in what is trading
By and large, anyone can trade. It does not require a university degree, license, or certificate.
However, this does not mean that desire is everything. Before you become a trader, you should go through several stages.
1. Gain theoretical and practical knowledge. All the necessary information can be found on broker websites, YouTube, investor blogs, and so on.
Taking a training course offered by practicing traders and reading books about trading would also be helpful.
You must never stop learning, even when you are already a trader.
Demo trading is the best way to test your skills. By registering a demo account, the beginner can open and close transactions without investing their funds;
2. Choose a broker. The most important criterion when choosing an intermediary is its reliability.
Trading conditions are another crucial aspect, on which trading largely depends. You can select several brokers and compare their commissions, initial deposit sizes, etc.
The broker should offer plenty of assets for trading. Thus, if you decide to trade gold, make sure this instrument is on the intermediary’s list.
There also should be several withdrawal and deposit options. Check whether the options available suit you.
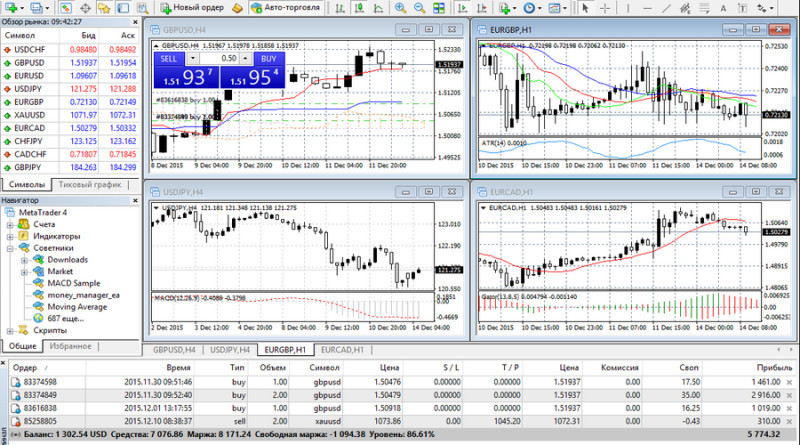
3. Install a trading platform. Brokers usually have all available trading platforms on their websites.
MetaTrader is the most popular trading software.
4. Decide on the amount of the initial deposit and top up your account. Experts say traders should begin with the smallest amount and never invest borrowed money in trading.
Common mistakes
We have outlined what trading is and how to get started in financial markets. Now let's list common mistakes beginners make.
Here is the table of those mistakes.
Mistakes of inexperienced traders
| Mistake | How it should be done |
| Excessive self-confidence, large investments | Begin with a demo account and then switch to the Cent account. Trade big only if you have enough experience |
| High expectations | No loss incurred is the best result you can count on at the very beginning. Expectations of making a profit right away lead to disappointment |
| Lack of knowledge | If there is not enough information to make a trading decision, it is better not to open a position at all than to take risks. |
| No trading plan | Develop a trading strategy and always stick to it, especially if you are a beginner |
| Neglect of Stop Loss and Take Profit | Never open trades without placing these orders. Trading without them is too risky |
| High leverage | Beginners should either not use leverage or use its minimum size |
| Trading too many assets | Novice traders should begin with just two instruments |
| Trading based on fear and greed | These emotions are the main enemies of successful trading. |
Pairs trading
Traders must decide which financial instrument to work with before trading. Notably, not one but several instruments correlating with each other can be traded.
That is called pair trading, which ensures risk diversification. However, this strategy is meant for savvy traders only.
Here it is important to find two financial instruments that are in correlation for a long time, like shares of companies operating in the same field.
Pairs trading also uses currency pairs, crypto, and derivatives.
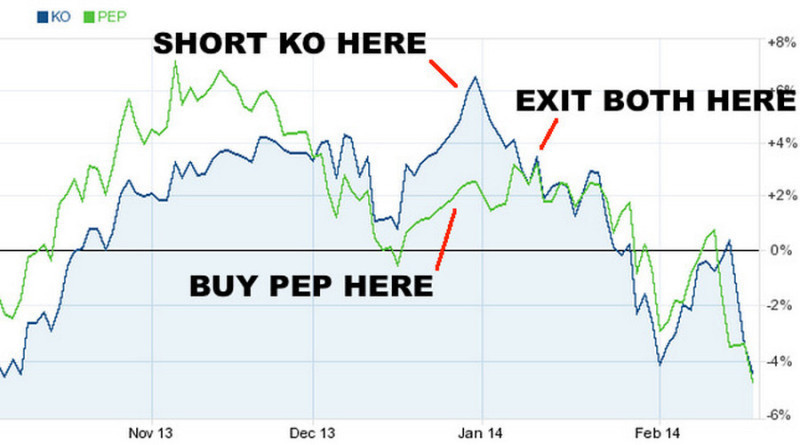
This strategy is used to identify deviations in the price of paired assets. In this case, the asset with a higher price gets sold and the one with a lower price is bought.
When equilibrium is achieved, trades get closed. If financial instruments are chosen right, a balance is always restored, which promises potential profits.
Here is an example of pairs trading with two different equities.
Basics of pairs trading:
- Positions are opened when correlation fails. Quote history is used to check the biggest spread.
- Either one or two assets can both be bought and sold.
- Moving Averages are used to confirm signals.
- Stop Loss and Take Profit orders are not used although they are still necessary for beginners.
- When equilibrium is achieved, positions are closed.
- Indicators can be used when implementing pairs trading. Still, entry and exit points are usually set approximately.
Types of trading
Starting a journey in financial markets, traders must decide what kind of trading they will be engaged in. As a rule, this choice is made once, so this issue must be taken seriously.
Types of trading:
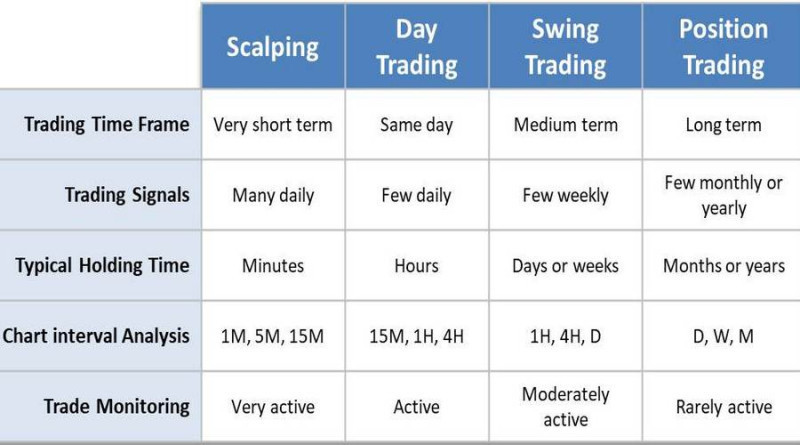
- Intraday trading is about opening and closing positions within one day. It is one of the most commonly used types of trading.
- Scalping is also a day trading technique but trades are conducted within minutes and even seconds.
- HFT is the fastest trading option. Each position is opened and closed in a split second by trading robots.
- Swing trading refers to a trading style where trades are held for several days to profit from price swings.
- Position trading is a type of trading where positions are held for a long period of time and rely on fundamentals.
- Medium-tern and long-term trading refers to trading styles where trades are held for a long period of time, which is usually weeks or months.
- Investing is about holding positions for months or years.
Traders must choose a type of trading depending on their abilities. For instance, scalping will require remarkable skills and a lot of time, so this option is not for beginners.
Intraday trading is perhaps the most common option. It is used by novice traders and professionals and does not take very much time.
Trading strategies
A trading strategy is a set of rules by which positions are opened on exchanges.
They can be ready-made (ex., Martingale method) and customized.
Trading is difficult, and sometimes impossible, without a strategy. Traders feel unprepared, not able to quickly respond to the market situation, and as a result, they incur losses.
Strategies contain the following information:
- The type of analysis to be used.
- Conditions for opening positions and placing stop orders.
- Rules for closing positions. These are usually opposite signals to those used to enter;
- Conditions for holding positions.
- Trading frequency and working time frames;
- Risk management rules (risk per trade, the maximum number of positions).
- Ways to correct mistakes.
- Signals to stop trading. Even the most effective strategy fails over time. That is why it is important to have a list of signs that will indicate the need to adjust your approach.
Strategies can be classified depending on the duration of holding positions: short-term, medium-term, or long-term.
They can also involve trading with the trend, against it, or during a consolidation phase.
Traders should choose or develop a trading style based on their own requests, interests, and personalities.
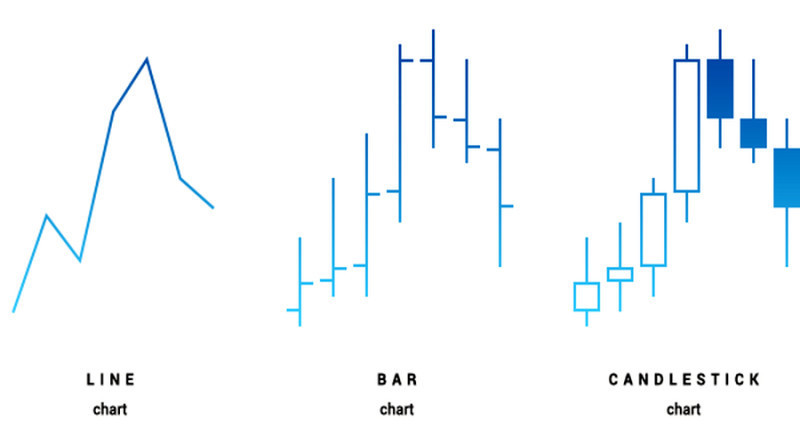
Types of charts
A price chart is one of the key trading tools. There are line charts, bar charts, and candlestick charts.
Types of analysis depend on the types of charts.
Volume Spread Analysis is used with candlestick charts and bar charts. It is based on trading volumes for a certain period of time.
It also uses the spread of a candlestick or a bar. It is the difference between the high and the low.
The idea of this type of analysis is that the price and volumes are correlated. When there is no balance in the demand/supply ratio, traders can yield profits on an impulse.
The line chart is the simplest one. It is commonly applied by beginners. By knowing the basics, they can understand where the price will go and how it changed in the past.
The Close Price is used for plotting the line chart. However, it is a less informative chart compared to bars and candlesticks.
The bar and candlestick charts contain the following information:
- Open Price and Close Price
- High Price and Low Price
In other words, the line chart illustrates only one indicator. Meanwhile, the bar chart and the candlestick chart show four indicators, their main benefit.
In addition, candlesticks are of different colors, which simplifies their analysis. Black (red) candlesticks show a fall in price over a period of time (the Open price is below the Close Price).
Green and white bars illustrate growth. That is why traders prefer the candlestick chart to the bar chart.
Spreads in trading
Price fluctuations are what make profits possible. Buyers strive to open positions at the lowest price, whereas sellers tend to open them at the lowest one.
When talking about prices, we should also mention spreads. A Spread is a range between the ask price and the bid price over a period of time.
For instance, a stock spread is a difference between the ask price and the bid price of an asset. The bigger the spread, the less liquid the market.
In addition, a spread can show the difference between:
- the current price and the past price
- the price of assets of the same class (ex., assets of the same index);
- the yield of assets.
Still, the Bid-Ask spread is commonly used.
Spreads are classified in several ways:
Classification 1: fixed and floating spreads.
Fixed spreads set by brokers never change. They are mainly used when trading currency pairs.
Meanwhile, floating spreads can change depending on the market situation.
Classification 2: inter-market spreads and intra-market spreads. As the name suggests, they are used within one or more markets.
Spreads have a noticeable influence on short-term trading. Traders should choose assets with a small spread.
To minimize costs, traders should use pending orders and work with high-liquidity assets.
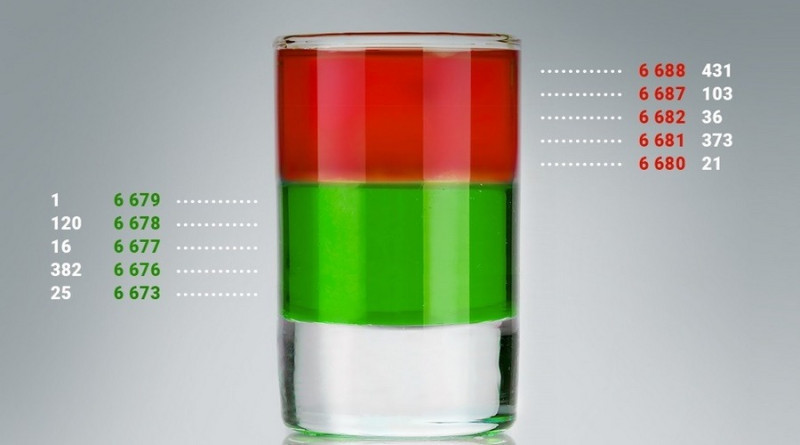
Traders’ guide is the stock order book, which contains all the buy and sell prices.
The information is grouped. Pending sell orders are usually placed first, the list starts with the highest value and ends with the lowest one.
Below are buy orders in descending order. When orders are executed, they automatically disappear from the table.
In the center of the order book, you can find the most favorable prices for transactions. The order book also provides information on how the spread changes.
How much traders earn
Everyone wants to know how much traders earn. However, there is no straight answer to this question.
Traders can earn from $100 to hundreds of thousands of dollars a month. Some, on the contrary, incur losses. It all depends on experience, deposit amounts, strategies, etc.
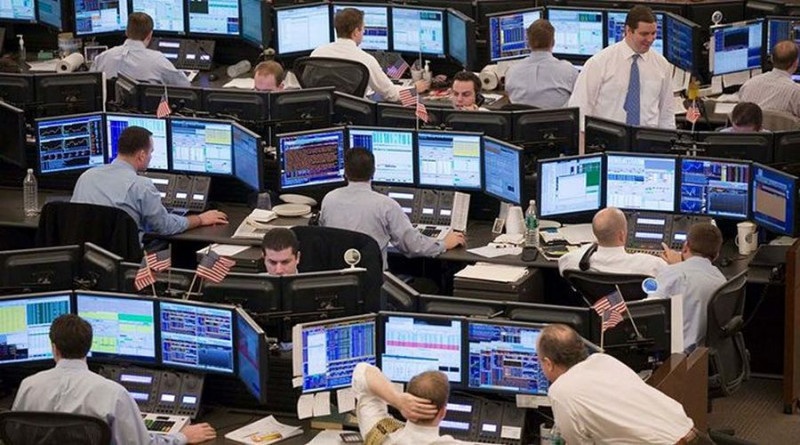
Above all else, traders can be private or hired by big companies, banks, and hedge funds.
The average annual salary of a trader in some UK companies:
- J.P. Morgan – about $111,000
- Barclays – about $142,000
- Goldman Sachs – about $106,000.
However, income depends not only on the company. Statistics show that salaries vary by country as well.
In the United States, institutional traders earn about $125,000 a year, in Japan - about $53,000, in China - about $25,000.
As for private traders, here everything depends solely on the effectiveness of a strategy and how much money is invested in trading.
For example, if a beginner yields a 5% profit a month, it is considered an excellent result. By investing $500 and $5,000 in a position, a profit will be $25 and $250 respectively.
Meanwhile, what matters to professionals is not a record profit but how frequently it is earned. For instance, if a trader yields a 10% profit following a conservative strategy, it is considered to be a good result.
Aggressive trading may bring about 30% of the profit. However, risks in this case are not always justified.
Traders are not professionals if they receive a 20% profit one month and incur losses the following months.
Prop trading companies
Regardless of the strategy you follow, you still need startup money. Unless you trade in a demo account, of course. In this case, you trade virtual funds.
However, what if you have no money at all? Prop trading is your way out.
This is when prop companies lend a certain amount of funds to traders, who invest them in trading and divide profits with those firms.
In this case, both parties get benefits.
Features of prop trading:
- Traders should be professionals. Companies offer courses for them to level up.
- Risk managers give tips on how to minimize losses and avoid drawdowns.
- Traders do not risk their own money.
- Trades are executed instantly because props have high-speed connections to the markets;
- Trading commissions are small thanks to special tariffs for prop companies
- An extensive list of trading instruments, advanced software;
- Prop traders can communicate with each other, share forecasts and market analysis in corporate chats;
- Opportunities of working remotely or in the office.
- There are no penalties for losing trades, but companies are interested in cooperation with successful traders. Otherwise, the trading account may be blocked. Traders’ profit also depends on the rating.
If you just start to work with financial platforms and want to join a team of prop traders, you will have to study a lot.
You must also realize that you begin from scratch. Even when you advance in the rating, you will still be under the control of risk managers.
Trend and consolidation
Chart analysis is one of the most important skills in trading. Trends differ from a sideways movement, which is also referred to as a flat or consolidation.
Consolidation Forex in trading is an insignificant change in the price of an asset, which fluctuates within a certain range.
A flat indicates that a trend has either stopped or paused for a while. Based on this, consolidation can occur both in the middle of an upward or downward movement and after its completion, that is, before a reversal.
During consolidation phases, traders make decisions reluctantly. They as if expect new market developments.
At times of trend movements, traders have limited trading possibilities, especially if fluctuations occur within narrow ranges. Only scalpers are able to benefit from such situations because they buy when the price reaches the upper limit of a corridor and sell near the lower limit.
Other traders open positions when there is a breakout through the upper or lower limit of a range.
Unlike consolidation, a trend goes in a certain direction. If the price rises over a period of time, it is a bull trend. If it falls, it is a bear trend.
Trendlines are plotted by extreme points. When it is an uptrend, trendlines are drawn by extreme lows. Such lines serve as support.
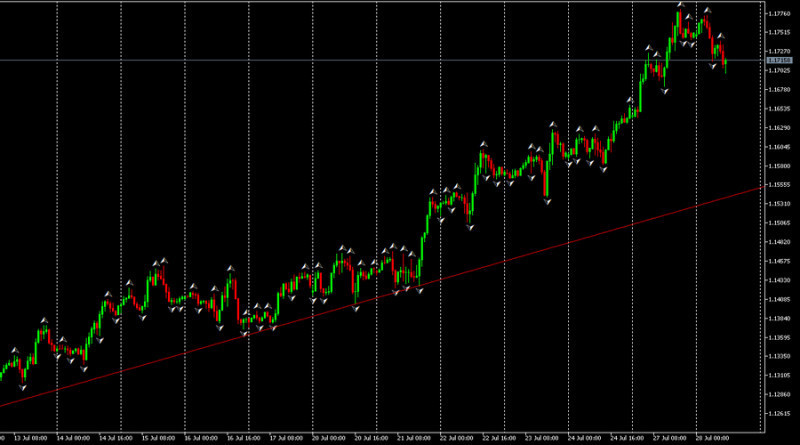
When the price is in a downtrend, they are plotted by extreme highs, providing resistance.
Deviations in financial markets
Experienced traders have repeatedly faced situations when the price changes unexpectedly and sharply. Volatility soars, potentially profitable positions get closed, and losses are incurred.
This is what is called standard deviation trading strategy. Trading in such cases requires a special approach.
First, you should have data about standard deviations ahead of opening positions. With the help of this tool, you can see past price changes to make future volatility forecasts.
The Deviation indicator to calculate standard deviations and apply them to the chart. The idea of this indicator is that big and small deviations interchange.
When standard deviations are big, the current price is higher than that in the past, and the indicator is moving up.
In the future, volatility is likely to decrease. As we have already said, the phases alternate.
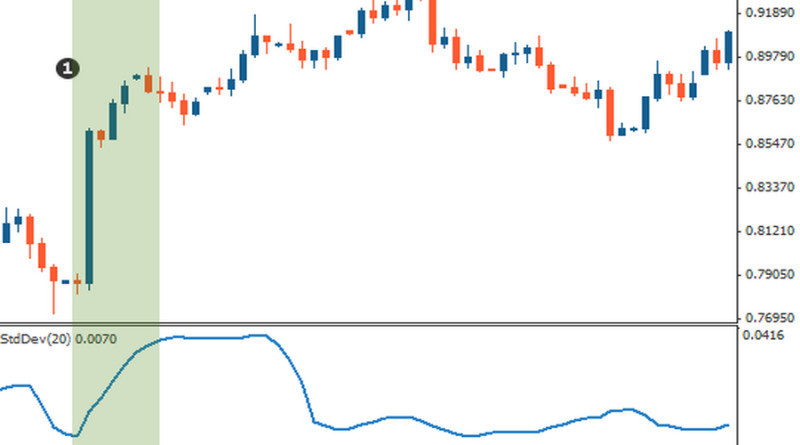
When the indicator curve is located at a low level, volatility is small. In this case, we may expect the price to either go up or down soon, i.e. an increase in volatility.
Deviations can be foreseen. The most important here is to use the signal in time. At the same time, the indicator does not show the trend.
The curve may rise when there is a sharp and significant increase in the value of an asset. However, it will still behave the same way in case of a collapse.
How to use deviations
Savvy traders often use tools that can generate signals, of which divergence is the most important.
Let’s find out what is divergence in trading.
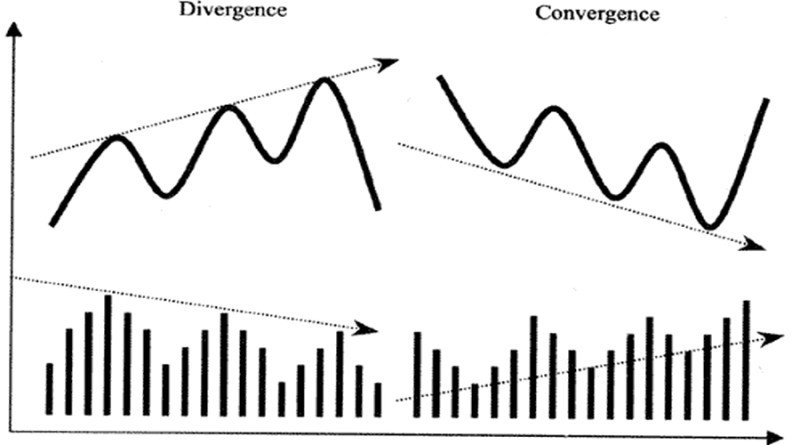
Put simply, divergence is when the price of an asset is moving in the opposite direction of an indicator. For example, the price goes up, and the indicator moves down.
This indicates that the current trend is getting slower and a reversal or a correction is impending. To detect divergences traders use such indicators as the RSI, MACD, etc.
Divergences occur before reversals, which helps traders realize what to do next.
Types of divergences:
- Bullish divergences are also called convergencies. In this case, the indicator moves up and the price goes down, which should be interpreted as a bullish reversal signal.
- Bearish divergences occur when the price rises and the indicator moves down. This is a signal of an impending bearish reversal.
However, the presence of a divergence on the chart does not mean a reversal will actually occur. Therefore, to confirm signals, additional tools should be used.
For example, traders use the volume indicator which moves up when there is a divergence and fundamental data.
Market analysis
Fundamental and technical analyses are the main analysis types. The fundamental analysis involves tracking factors that may affect quotes.
The economic calendar is the best tool for traders who do fundamental analysis.
Technical analysis is primarily based on maths. Past quotes are processed with the help of formulas. Data obtained is used to make forecasts.
The following methods are used for conducting technical analysis:
- Fractals trading analysis uses Bill Williams’ Fractals
- Wave analysis is about detecting wave cycles on the chart
- Graphic analysis is done to identify patterns (bar, line, and candlestick) on charts
- Analytics analysis is based on a row of indicators
- Channel analysis studies price channels
- Support and resistance
- Fibonacci levels
- Cluster analysis studies what is trading volumes at a selected price level
By analyzing these methods, it gets clear that they are interconnected. Therefore, there is no clear distinction between them.
Traders usually prefer technical analysis to fundamental one. They believe it is more informative and accurate. It is based on the idea that price trends tend to repeat and therefore is a great forecast tool.
Nevertheless, fundamental factors are as important.
That is why savvy traders used both methods. For instance, they check signals coming from indicators with data from the economic calendar.
Patterns in trading
Patterns are often used when conducting technical analysis. By detecting a formation in the chart, traders can predict further developments in the market.
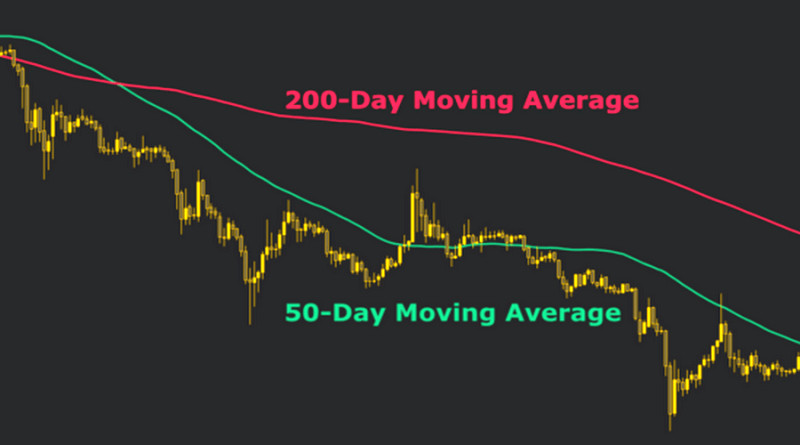
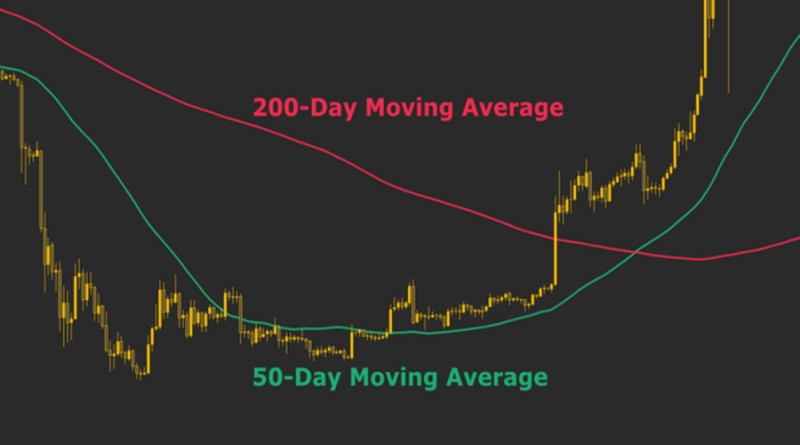
Let’s take the Death Cross trading. In fact, it is quite a widespread formation.
When it appears on the chart, it is a signal of a bear trend.
This pattern is formed with the help of two SMAs: slow and fast. When the line with period 50 crosses the one with period 20, sellers get stronger.
The formation resembles a cross on the chart, and this is where its name comes from.
Overall, there are about a dozen of patterns. They are based on the idea that the market moves in cycles that tend to repeat with time.
Let’s say we have a pattern that signals a bearish reversal, for example, the very same Deat Cross.
Why should a bearish reversal occur? Because it has occurred before.
As a rule, traders work with several patterns they trust the most. At the same time, neither pattern gives any guarantees.
They just signal the high likelihood of a certain market development under certain conditions. Therefore, such signals should be checked with the help of additional patterns.
With an abundance of formations, there are several approaches to their classification. Let’s take a look at the most common ones.
1. These are patterns that warn about the development of the current trend. This group includes formations such as the Rectangle, Flag, Pennant, and so on;
2. These are also bidirectional patterns that signal both an upcoming reversal and a trend continuation depending on the location of the pattern itself and its features.
For example, if we take the figure Triangle, trading is based on the location of a breakout and the shape of the formation in this case. If the pattern is symmetrical, the bulls and bears are equally strong.
A breakout occurs through the upper limit signals a bullish continuation. If the lower limit is broken, it is a signal of a bearish continuation.
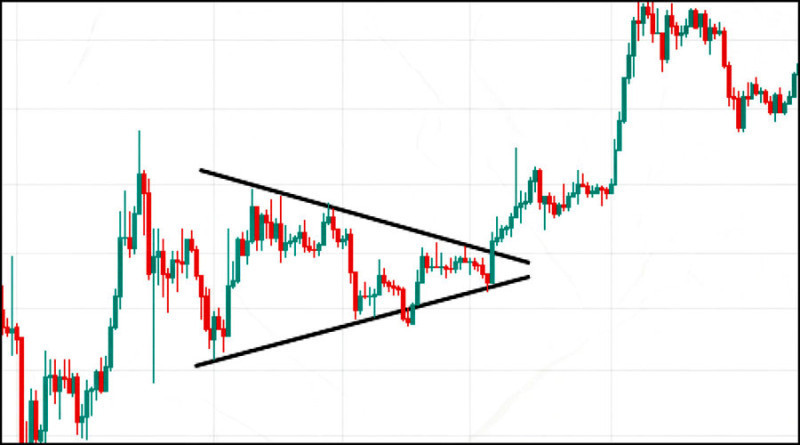
In addition to various types of the Triangle, this group of formations includes the Wedge.
3. Likewise, these are patterns signaling reversals, including the Head and Shoulders, Diamond, Double Bottom, and so on.
Formations are used when trading different assets, especially currencies (fiat and digital), and stocks.
These are also candlestick patterns that are detected on the same charts. They can also be reversal and conservation patterns.
The group of formations illustrating reversals includes the Hammer, Stars, and Harami. These are the most common candlestick patterns.
Patterns signaling a trend continuation are the Mat, Three methods, and so on.
Candlestick patterns can consist of a number of elements. For example, the Doji has one candlestick, while the Engulfing has two.
Sometimes one pattern can include five candlesticks.
Analysis of candlesticks:
- Location. Here it is about candlesticks located near the pattern.
- Size;
- Length.
Notably, patterns are mostly mirrored.
Thus, the Golden Cross trading has the same formation algorithm as the Death Cross.
In this case, however, the fast SMA crosses the slow one to the upside, a sign of a bull trend.
Patterns are commonly used in the trading community. All types are united in the Price Action system.
It has both advantages and disadvantages.
Advantages:
- identification of the best entry and exit points
- forecasting
- abundance of pattern
- no limitations in usage
- pattern indicators: they detect formations on the chart and inform users
The biggest disadvantage of Price Action is subjectivity. Users can interpret one and the same pattern differently.
Some can find patterns where there are non at all. Others can miss even obvious formations.
Patterns can sometimes be hard to identify, especially if they are complex formations.
There are no best or worst patterns. Traders determine them only on the basis of their own experience, through trial and error.
The use of Price Action as an independent strategy is bound to end in failure. Patterns are better used as assistance and not as a guide when making decisions.
What analysis type to choose
To succeed in financial markets, you should tests various analysis types and pick the one that works for you.
Experience is also important.
For instance, a beginner decides to use what is a cluster analysis. Trading will hardly be profitable in such a case. This is due to the fact that this analysis type is quite difficult and requires a lot of time to muster.
Therefore, beginners should use simpler technical analysis methods instead. ex., support and resistance.
When choosing the type of analysis, you should also pay attention to:
- Availability. If traders decide to use a set of indicators, they should make sure they are either available on the platform or can be added.
- Simplicity. Analyzing must not take too much time or energy. Otherwise, traders risk losing trading opportunities;
- Transparency. Traders should know how to use a certain analysis type. Otherwise, they can carry out the analysis wrong.
- Convenience: the analysis method must be helpful. For example, if the Elliott Waves overload the chart, the user should choose another option.
Newcomers who just start to learn about various types of financial market analysis may experience confusion and fear. However, everything falls into place when they have a broad knowledge of each option.
In order not to lose money when testing different analysis methods, traders use a demo account.
Indicator trading
Indicators can simplify trading significantly. These algorithms are based on complex mathematical formulas.
The trader does not need to understand them as this is an automatic process. Such calculations can be used in trading.
The most common signals that indicators generate are buy or sell.
Indicators can be divided into the following types:
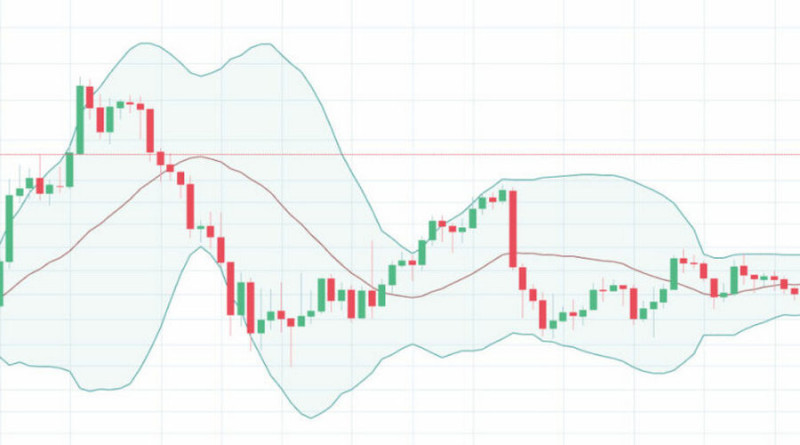
- Trend indicators track price movements (ex. Moving Averages, Bollinger Bands, Fractals, Parabolic SAR, etc.)
- Oscillators detect overbought and oversold zones. They are effective during sideways movements. (ex. Stochastic, RSI, MACD)
- Williams algorithms (MFI, Alligator, Awesome Oscillator, etc). The indicators of this analyst are singled out because of the difference in technical analysis interpretation. Volume indicators (Volumes, OBV);
- Channels (Keltner channels, Andrews pitchforks).
Still, some indicators can belong to several groups. For example, Bollinger bands can be both a trend indicator and a channel indicator.
Indicators are mainly used for trading stop. Long-term investors prefer analyzing fundamentals.
Many indicators are installed in platforms by default. Some need to be downloaded and installed and some of them are paid.
Stop orders in trading
Despite a variety of forecast methods, it can be that predictions do not come true. To minimize losses, a Stop order is used.
Thus, when the price goes in the opposite direction, a Stop Loss order will trigger and a position will be closed automatically.
Stop orders can be adjusted automatically with the help of a Trailing Stop. It often sets a Stop Loss at the breakeven point when the price moves in line with the forecast.
Automatic triggering of a stop order protects traders from losses in case of a reversal. A Trailing Stop moves with the price, minimizing risks and not limiting potential profits.
A Trailing Stop is used in the following case:
- When the price soars or plummets
- When traders do not track the market situation regularly
A Stop Loss is set on the server before and after position opening. A Trailing Stop is set on the platform at the very moment a position is opened. Both are complementary.
Still, it is important to remember that a Trailing Stop does not work when the platform is off.
Aspects to pay attention to when placing a Stop order:
- losses traders may afford to lose. However, when there is a small distance to a Stop Loss, it may even be triggered by insignificant correction.
- volatility
- trading strategy
- trading volume
Both a Stop Loss and a Trailing Stop have a number of benefits. They help minimize risks, reduce stress, and save time.
They are also free of charge, and their settings are user-friendly.
Apart from stop orders, there are also pending orders such as a Take Profit. They limit profits.
Someone may question their necessity if the price goes in line with the forecast.
The thing is that any trend ends sooner or later. Attempts to earn the maximum profit by holding positions for as long as possible may result in losses.
With a Take Profit, you can avoid losses.
Trading psychology
Trading psychology is one of the keys to success in the market. It is about trader personality and market sentiment.
Let’s take FOMO trading. It is the fear of missing out on a big opportunity in the market.
Let’s assume the trader opens a long position at the very beginning of a bull trend.
Indicators show an impending reversal. The trader decides not to wait for a reversal and closes a position.
However, a reversal does not occur, and the asset continues to strengthen. The trader feels emotionally distressed. This is a FOMO syndrome.
The trader blames himself for not holding the position and earning even more.
Apart from FOMO, there are other syndromes that have a negative impact on trading, ex. Imposter syndrome.
Experienced and successful traders often tend to belittle their achievements. They believe that they are incompetent and their profit is nothing more than just luck and has nothing to down with hard work.
They become uncertain and unenthusiastic. Hunted by the imposter syndrome for a long time, successful traders are likely to become outsiders.
Tips on how to minimize the impact of these syndromes:
- Develop critical thinking skills. Proper self-esteem is key.
- Do not be a perfectionist. Everybody makes mistakes.
- Never stop leveling up.
- If you have a successful experience, fight indecision. If the goal seems unattainable, strive to achieve it step by step.
Traps
Prices are in constant movement. Sometimes, they can be predicted, sometimes not. This is what is called a trap.
1. A bear trap trading may lead to losses when there is a sharp price fall amid a bull trend.
Let’s say there is a steady bull trend. However, an unexpected drop occurs below support. It is a short decline, and the bull trend resumes.
By opening a short position before the trend resumes, the trader incurs losses.
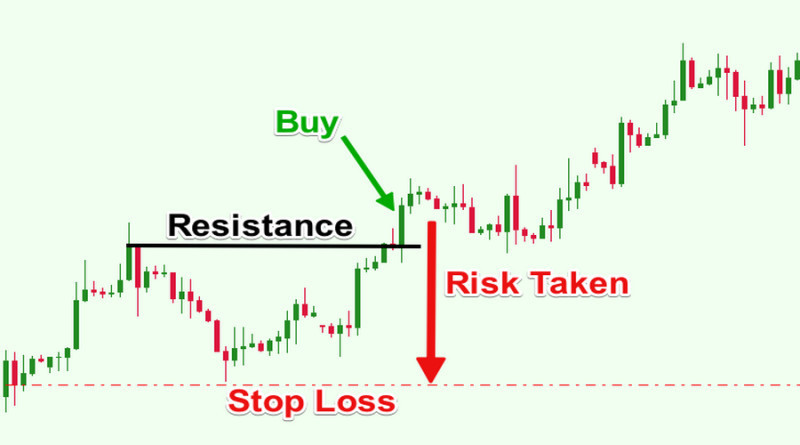
2. A bull trap is a mirror pattern of a bear trap. Traders can open long positions when the price breaks through resistance.
When the bear trend resumes, traders lose money.
Traps can be deliberate. Large players attempt to fool the rest and earn. Sometimes, they are triggered by some fundamental factors such as macro data, policymakers’ statements, etc.
Traps can occur in different markets, including crypto, stock, and forex.
In order not to fall into traps, you should use various technical analysis tools such as the Fibonacci technique, and trading volume analysis.
When a reversal is not followed by an increase in trading volumes, it is a trap, not a reversal.
Beginners and very emotional traders usually get trapped. By making a spontaneous decision, they lose their money and become frustrated with trading.
There is also a risk of being deceived when using not enough analysis tools. In this case, signals are not checked in any way.
Final thoughts
In this article, you can find the basic information about what is trading.
Key takeaways:
- Trading is associated with speculation in financial markets. Traders make money by buying assets at a low price and selling them at a high price.
- Traders’ income depends on their experience, knowledge, and investment amounts.
- People can trade on their own or via a prop company.
- Trading is impossible without a strategy.
- There are different ways of analyzing the market. You should pick the one that works for you.


